Estimated Value: $269,000 - $295,000
4
Beds
3
Baths
1,763
Sq Ft
$160/Sq Ft
Est. Value
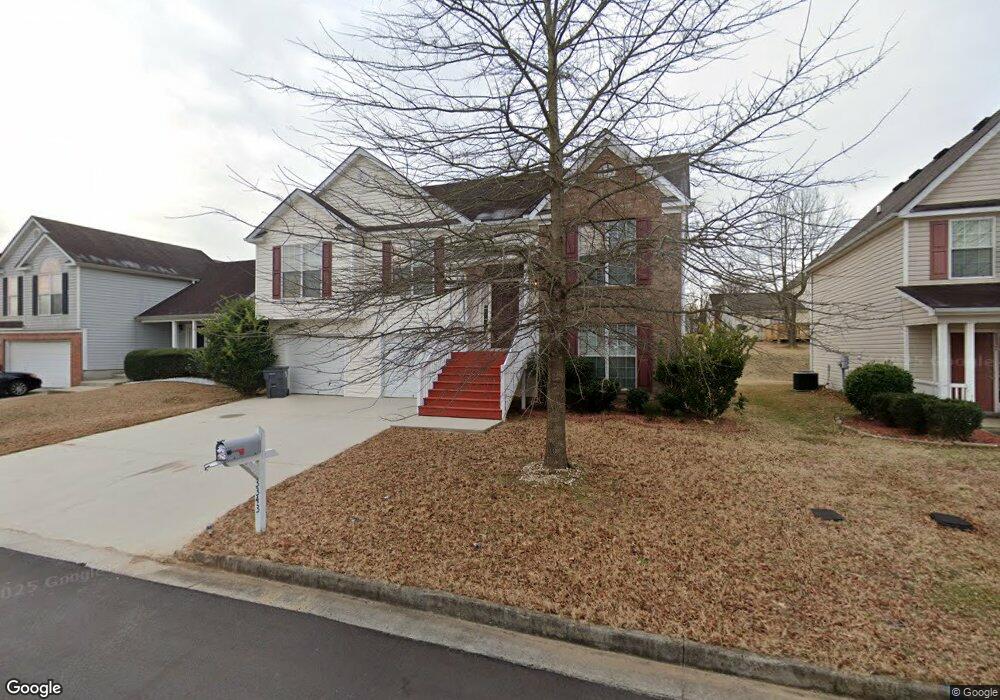
About This Home
This home is located at 3343 Waggoner Way, Rex, GA 30273 and is currently estimated at $282,000, approximately $159 per square foot. 3343 Waggoner Way is a home located in Clayton County with nearby schools including East Clayton Elementary School, Adamson Middle School, and Morrow High School.
Ownership History
Date
Name
Owned For
Owner Type
Purchase Details
Closed on
Jan 8, 2013
Sold by
St Paul Arnold
Bought by
L&S Georgia Properties Llc
Current Estimated Value
Purchase Details
Closed on
Sep 27, 2011
Sold by
Secretary Of Housing And U
Bought by
Paul Arnold St and Leibof Allan
Purchase Details
Closed on
Jul 6, 2010
Sold by
Everbank
Bought by
Hud-Housing Of Urban Dev
Purchase Details
Closed on
May 6, 2005
Sold by
Gt Architecture Contractors Corp
Bought by
Cullom Cornell
Home Financials for this Owner
Home Financials are based on the most recent Mortgage that was taken out on this home.
Original Mortgage
$150,483
Interest Rate
5.8%
Mortgage Type
VA
Purchase Details
Closed on
Jan 19, 2005
Sold by
Southside Dev Inc
Bought by
Gt Architecture Contractors Corp
Home Financials for this Owner
Home Financials are based on the most recent Mortgage that was taken out on this home.
Original Mortgage
$914,569
Interest Rate
5.62%
Create a Home Valuation Report for This Property
The Home Valuation Report is an in-depth analysis detailing your home's value as well as a comparison with similar homes in the area
Home Values in the Area
Average Home Value in this Area
Purchase History
| Date | Buyer | Sale Price | Title Company |
|---|---|---|---|
| L&S Georgia Properties Llc | -- | -- | |
| Paul Arnold St | $36,600 | -- | |
| Hud-Housing Of Urban Dev | -- | -- | |
| Everbank | $185,809 | -- | |
| Cullom Cornell | $151,700 | -- | |
| Gt Architecture Contractors Corp | $272,000 | -- |
Source: Public Records
Mortgage History
| Date | Status | Borrower | Loan Amount |
|---|---|---|---|
| Previous Owner | Cullom Cornell | $150,483 | |
| Previous Owner | Gt Architecture Contractors Corp | $914,569 |
Source: Public Records
Tax History Compared to Growth
Tax History
| Year | Tax Paid | Tax Assessment Tax Assessment Total Assessment is a certain percentage of the fair market value that is determined by local assessors to be the total taxable value of land and additions on the property. | Land | Improvement |
|---|---|---|---|---|
| 2024 | $4,454 | $113,200 | $8,800 | $104,400 |
| 2023 | $3,627 | $119,280 | $8,800 | $110,480 |
| 2022 | $3,939 | $99,400 | $8,800 | $90,600 |
| 2021 | $3,108 | $77,720 | $8,800 | $68,920 |
| 2020 | $2,855 | $70,423 | $8,800 | $61,623 |
| 2019 | $2,451 | $59,440 | $8,800 | $50,640 |
| 2018 | $2,178 | $52,715 | $8,800 | $43,915 |
| 2017 | $1,850 | $44,527 | $8,800 | $35,727 |
| 2016 | $1,422 | $34,012 | $8,800 | $25,212 |
| 2015 | $1,284 | $0 | $0 | $0 |
| 2014 | $1,260 | $30,733 | $9,600 | $21,133 |
Source: Public Records
Map
Nearby Homes
- 3456 Heartland Dr Unit 2
- 3548 Meadowview Ct
- 3130 Rex Ridge Cir
- 6061 Tina Ln
- 5810 Mistyview Dr Unit 3
- 5652 Laney Dr
- 6139 Katherine Rd
- 6103 Chaseland Dr
- 6103 Chaseland Rd
- 6057 Dorchester Dr
- 5705 Laney Dr
- 5631 Laney Dr
- 3694 Rex Rd
- 5861 Colonnade Dr
- 5610 Swanson Rd
- 3078 Caliente Ln
- 3645 Fay Dr Unit 1
- 5578 Swanson Rd
- 3709 Charlotte Dr
- 3203 Pawnee Dr
- 3349 Waggoner Way
- 3337 Waggoner Way
- 3336 Waggoner Ln
- 3330 Waggoner Ln
- 3342 Waggoner Ln
- 3355 Waggoner Way
- 3331 Waggoner Way Unit 3331
- 3331 Waggoner Way Unit 152C
- 3338 Waggoner Way
- 3348 Waggoner Ln
- 3344 Waggoner Way
- 3332 Waggoner Way
- 5969 Waggoner Ct
- 3361 Waggoner Way
- 5963 Waggoner Ct
- 3350 Waggoner Way Unit 152
- 3350 Waggoner Way
- 3325 Waggoner Way
- 3326 Waggoner Way
- 5959 Waggoner Ct