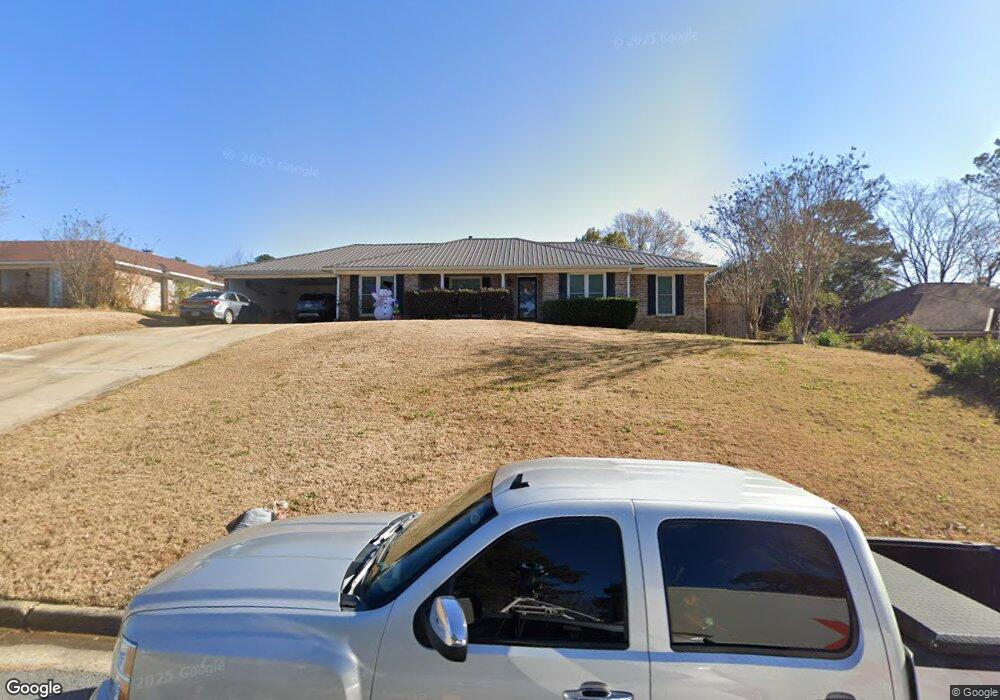
3343 Windermere St Columbus, GA 31909
North Columbus NeighborhoodEstimated Value: $318,701 - $367,000
4
Beds
3
Baths
2,732
Sq Ft
$128/Sq Ft
Est. Value
About This Home
This home is located at 3343 Windermere St, Columbus, GA 31909 and is currently estimated at $350,925, approximately $128 per square foot. 3343 Windermere St is a home located in Muscogee County with nearby schools including Blanchard Elementary School, Veterans Memorial Middle School, and Hardaway High School.
Ownership History
Date
Name
Owned For
Owner Type
Purchase Details
Closed on
Apr 13, 2020
Sold by
Huffman Michael T
Bought by
Schwarz Melissa
Current Estimated Value
Home Financials for this Owner
Home Financials are based on the most recent Mortgage that was taken out on this home.
Original Mortgage
$253,820
Outstanding Balance
$224,427
Interest Rate
3.3%
Mortgage Type
VA
Estimated Equity
$126,498
Purchase Details
Closed on
Jan 31, 2018
Sold by
Meadows James D
Bought by
Huffman Michael T and Huffman Tara M
Home Financials for this Owner
Home Financials are based on the most recent Mortgage that was taken out on this home.
Original Mortgage
$241,205
Interest Rate
3.95%
Mortgage Type
VA
Purchase Details
Closed on
Jan 19, 2010
Sold by
Merritt Paul T and Merritt Pamela G
Bought by
Meadows James D
Home Financials for this Owner
Home Financials are based on the most recent Mortgage that was taken out on this home.
Original Mortgage
$240,562
Interest Rate
3.62%
Mortgage Type
FHA
Create a Home Valuation Report for This Property
The Home Valuation Report is an in-depth analysis detailing your home's value as well as a comparison with similar homes in the area
Home Values in the Area
Average Home Value in this Area
Purchase History
| Date | Buyer | Sale Price | Title Company |
|---|---|---|---|
| Schwarz Melissa | $245,000 | -- | |
| Huffman Michael T | $233,500 | -- | |
| Meadows James D | $245,000 | None Available |
Source: Public Records
Mortgage History
| Date | Status | Borrower | Loan Amount |
|---|---|---|---|
| Open | Schwarz Melissa | $253,820 | |
| Previous Owner | Huffman Michael T | $241,205 | |
| Previous Owner | Meadows James D | $240,562 |
Source: Public Records
Tax History Compared to Growth
Tax History
| Year | Tax Paid | Tax Assessment Tax Assessment Total Assessment is a certain percentage of the fair market value that is determined by local assessors to be the total taxable value of land and additions on the property. | Land | Improvement |
|---|---|---|---|---|
| 2025 | -- | $113,912 | $13,496 | $100,416 |
| 2024 | -- | $113,912 | $13,496 | $100,416 |
| 2023 | $0 | $113,912 | $13,496 | $100,416 |
| 2022 | $2,100 | $92,432 | $13,496 | $78,936 |
| 2021 | $3,972 | $97,268 | $13,496 | $83,772 |
| 2020 | $2,734 | $80,336 | $13,496 | $66,840 |
| 2019 | $2,745 | $80,336 | $13,496 | $66,840 |
| 2018 | $3,468 | $80,336 | $13,496 | $66,840 |
| 2017 | $3,481 | $80,336 | $13,496 | $66,840 |
| 2016 | $3,495 | $98,000 | $9,515 | $88,485 |
| 2015 | $3,500 | $98,000 | $9,515 | $88,485 |
| 2014 | $3,505 | $98,000 | $9,515 | $88,485 |
| 2013 | -- | $98,000 | $9,515 | $88,485 |
Source: Public Records
Map
Nearby Homes
- 5836 Sherborne Dr
- 5921 Canterbury Dr
- 6002 Canterbury Dr
- 5531 Mariner Dr
- 3325 N North Quay Dr
- 3710 Winkfield Place
- 3091 Mustang Dr
- 6221 Charing Dr
- 5435 Wayne Dr
- 5552 Perry Ave
- 3618 Grier Ave
- 5829 Moon Rd
- 3824 Lyn Dr
- 6308 Adams Park Dr
- 6104 Candlestick Loop
- 3616 Weems Rd
- 3623 Gray Fox Dr
- 6226 Westbrook Dr
- 6232 Westbrook Dr
- 5224 Miller Rd
- 3337 Windermere St
- 3351 Windermere St
- 5841 Wiltshire Dr
- 5901 Wiltshire Dr
- 5835 Wiltshire Dr
- 3331 Windermere St
- 3359 Windermere St
- 3348 Windermere St
- 5907 Wiltshire Dr
- 3342 Windermere St
- 5829 Wiltshire Dr
- 3356 Windermere St
- 3334 Windermere St
- 3323 Windermere St
- 3365 Windermere St
- 5913 Wiltshire Dr
- 3362 Windermere St
- 5823 Wiltshire Dr
- 3328 Windermere St
- 5842 Wiltshire Dr