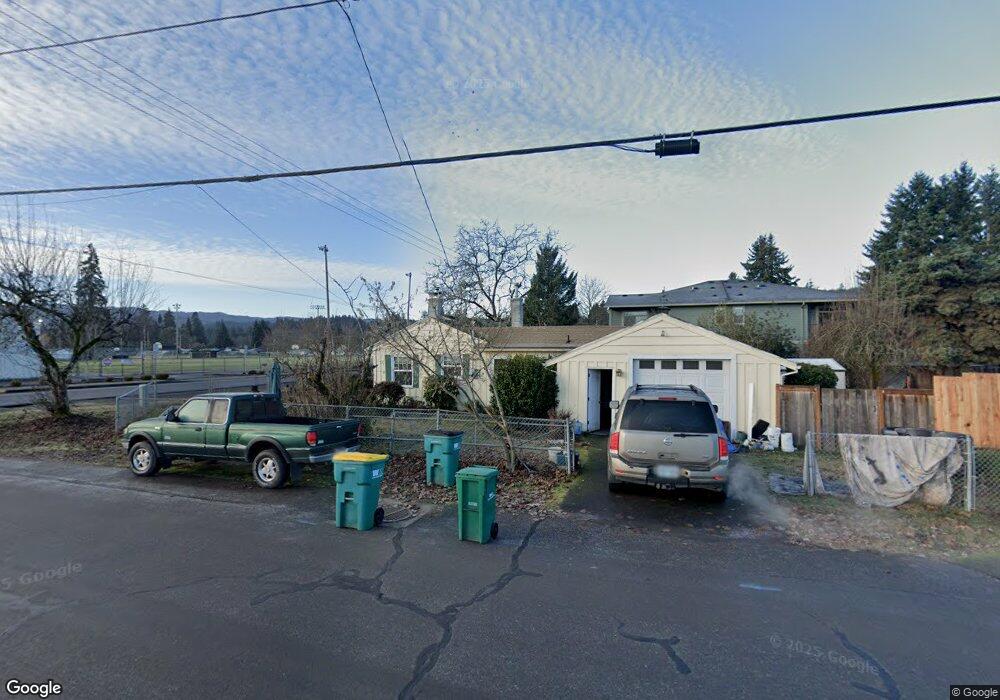
33443 SW Maple St Scappoose, OR 97056
Estimated Value: $358,767 - $430,000
3
Beds
1
Bath
1,252
Sq Ft
$318/Sq Ft
Est. Value
About This Home
This home is located at 33443 SW Maple St, Scappoose, OR 97056 and is currently estimated at $397,942, approximately $317 per square foot. 33443 SW Maple St is a home located in Columbia County with nearby schools including Scappoose High School, South Columbia Family School, and Scappoose Adventist School.
Ownership History
Date
Name
Owned For
Owner Type
Purchase Details
Closed on
Jul 5, 2018
Sold by
Branch David M and Branch Susan D
Bought by
33443 Sw Maple St Llc
Current Estimated Value
Purchase Details
Closed on
Jul 7, 2016
Sold by
Abbott Wendi M and Abbott Klostermann William R
Bought by
Branch David M and Branch Susan D
Home Financials for this Owner
Home Financials are based on the most recent Mortgage that was taken out on this home.
Original Mortgage
$152,000
Interest Rate
3.64%
Mortgage Type
New Conventional
Purchase Details
Closed on
Dec 1, 2005
Sold by
Abbott Wendi M
Bought by
Abbott Wendi M and Abbott Klostermann William R
Purchase Details
Closed on
Jun 15, 2005
Sold by
Harding Sherry A
Bought by
Abbott Wendi M
Home Financials for this Owner
Home Financials are based on the most recent Mortgage that was taken out on this home.
Original Mortgage
$139,200
Interest Rate
5.65%
Mortgage Type
Fannie Mae Freddie Mac
Create a Home Valuation Report for This Property
The Home Valuation Report is an in-depth analysis detailing your home's value as well as a comparison with similar homes in the area
Home Values in the Area
Average Home Value in this Area
Purchase History
| Date | Buyer | Sale Price | Title Company |
|---|---|---|---|
| 33443 Sw Maple St Llc | -- | None Available | |
| Branch David M | $190,000 | Columbia County Title | |
| Abbott Wendi M | -- | Ticor Title | |
| Abbott Wendi M | $174,000 | Ticor Title |
Source: Public Records
Mortgage History
| Date | Status | Borrower | Loan Amount |
|---|---|---|---|
| Previous Owner | Branch David M | $152,000 | |
| Previous Owner | Abbott Wendi M | $139,200 |
Source: Public Records
Tax History Compared to Growth
Tax History
| Year | Tax Paid | Tax Assessment Tax Assessment Total Assessment is a certain percentage of the fair market value that is determined by local assessors to be the total taxable value of land and additions on the property. | Land | Improvement |
|---|---|---|---|---|
| 2025 | $2,651 | $160,990 | $95,160 | $65,830 |
| 2024 | $2,577 | $156,310 | $92,400 | $63,910 |
| 2023 | $2,553 | $151,760 | $80,670 | $71,090 |
| 2022 | $2,446 | $147,340 | $77,920 | $69,420 |
| 2021 | $2,376 | $143,050 | $82,230 | $60,820 |
| 2020 | $2,203 | $138,890 | $78,130 | $60,760 |
| 2019 | $2,146 | $134,850 | $75,350 | $59,500 |
| 2018 | $2,097 | $130,930 | $85,350 | $45,580 |
| 2017 | $2,059 | $127,120 | $82,870 | $44,250 |
| 2016 | $2,033 | $123,420 | $80,460 | $42,960 |
| 2015 | $1,930 | $119,830 | $71,270 | $48,560 |
| 2014 | $1,882 | $116,340 | $74,570 | $41,770 |
Source: Public Records
Map
Nearby Homes
- 33102 Felisha Way
- 33363 SW Rokin Way
- 33375 SW Rokin Way
- 33344 SW Rokin Way
- 33358 SW Rokin Way
- 33370 SW Rokin Way
- 33399 NW Ej Smith Rd
- 33374 Wickstrom Dr
- 51925 Columbia River Hwy
- 32898 SW Keys Landing Way
- 52866 NE 2nd St
- 51587 SE Oak St
- 51425 SE Oak St Unit 65
- 32839 SW Crystal Springs Ct
- 52256 SE 6th Ct
- 32904 NW View Terrace Place
- 52171 Casswell Dr
- 32922 Coal Creek Rd
- 32952 NW Ridge Dr
- 52144 SE 8th St
- 33443 SW Maple St
- 33421 SW Maple St
- 33409 SW Maple St
- 52346 SW 2nd St
- 33465 SW Maple St Unit 1
- 52371 SW 1st St
- 52366 SW 2nd St
- 33467 SW Maple St Unit 1
- 33371 SW Maple St
- 33371 SW Maple St
- 52345 SW 2nd St
- 52314 SW 3rd St
- 52326 SW 3rd St
- 52368 SW 1st St
- 52385 SW 1st St
- 52382 SW 2nd St
- 52342 SW 3rd St
- 52367 SW 2nd St
- 52339 Columbia River Hwy
- 52381 SW 2nd St