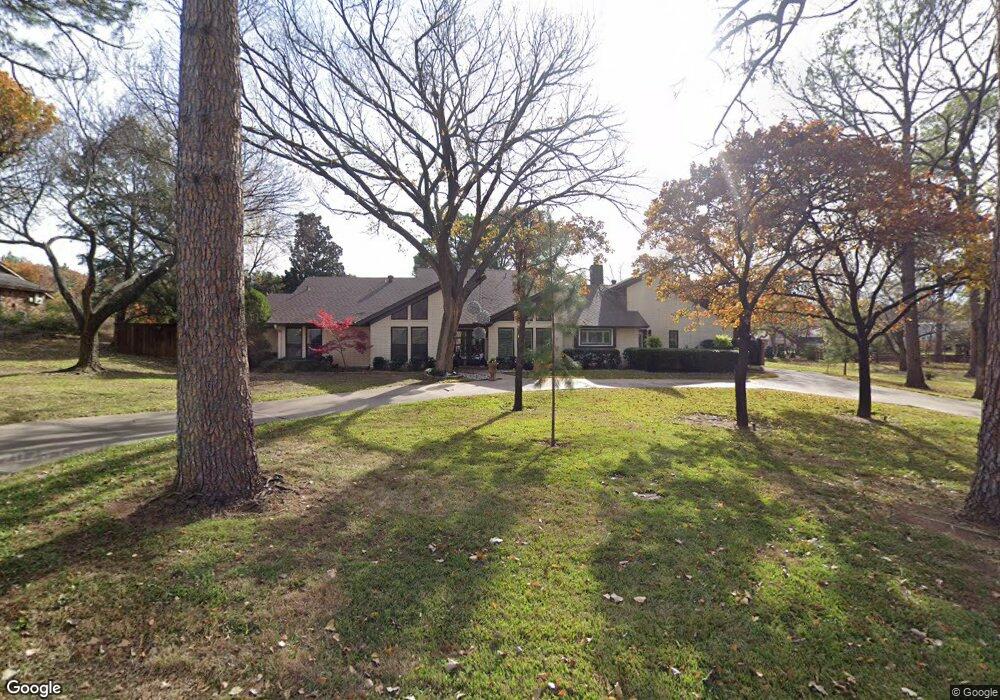
3345 Barberry Rd Grapevine, TX 76051
Estimated Value: $751,000 - $906,655
4
Beds
4
Baths
2,750
Sq Ft
$300/Sq Ft
Est. Value
About This Home
This home is located at 3345 Barberry Rd, Grapevine, TX 76051 and is currently estimated at $825,914, approximately $300 per square foot. 3345 Barberry Rd is a home located in Tarrant County with nearby schools including O.C. Taylor Elementary School, Cross Timbers Middle School, and Grapevine High School.
Ownership History
Date
Name
Owned For
Owner Type
Purchase Details
Closed on
Mar 26, 2013
Sold by
Towery Diane E
Bought by
Green Byron D
Current Estimated Value
Home Financials for this Owner
Home Financials are based on the most recent Mortgage that was taken out on this home.
Original Mortgage
$309,600
Outstanding Balance
$219,719
Interest Rate
3.59%
Mortgage Type
New Conventional
Estimated Equity
$606,195
Purchase Details
Closed on
Dec 1, 2011
Sold by
Towery Russell
Bought by
Towery Diane E
Home Financials for this Owner
Home Financials are based on the most recent Mortgage that was taken out on this home.
Original Mortgage
$70,000
Interest Rate
4.03%
Mortgage Type
New Conventional
Purchase Details
Closed on
Aug 24, 1994
Sold by
Deaton Dennis L and Deaton Phyllis A
Bought by
Towery Russell and Towery Diane
Home Financials for this Owner
Home Financials are based on the most recent Mortgage that was taken out on this home.
Original Mortgage
$172,800
Interest Rate
8.69%
Create a Home Valuation Report for This Property
The Home Valuation Report is an in-depth analysis detailing your home's value as well as a comparison with similar homes in the area
Home Values in the Area
Average Home Value in this Area
Purchase History
| Date | Buyer | Sale Price | Title Company |
|---|---|---|---|
| Green Byron D | -- | None Available | |
| Towery Diane E | -- | Rtt | |
| Towery Russell | -- | Commonwealth Land Title |
Source: Public Records
Mortgage History
| Date | Status | Borrower | Loan Amount |
|---|---|---|---|
| Open | Green Byron D | $309,600 | |
| Previous Owner | Towery Diane E | $70,000 | |
| Previous Owner | Towery Russell | $172,800 |
Source: Public Records
Tax History
| Year | Tax Paid | Tax Assessment Tax Assessment Total Assessment is a certain percentage of the fair market value that is determined by local assessors to be the total taxable value of land and additions on the property. | Land | Improvement |
|---|---|---|---|---|
| 2025 | $2,206 | $805,950 | $300,415 | $505,535 |
| 2024 | $2,206 | $805,950 | $300,415 | $505,535 |
| 2023 | $9,848 | $620,399 | $300,415 | $319,984 |
| 2022 | $10,580 | $573,054 | $300,415 | $272,639 |
| 2021 | $10,556 | $485,481 | $250,830 | $234,651 |
| 2020 | $10,206 | $485,481 | $250,830 | $234,651 |
| 2019 | $9,619 | $491,233 | $250,830 | $240,403 |
| 2018 | $2,280 | $383,461 | $250,830 | $132,631 |
| 2017 | $8,062 | $465,547 | $250,830 | $214,717 |
| 2016 | $7,329 | $476,534 | $247,830 | $228,704 |
| 2015 | $6,219 | $288,100 | $40,000 | $248,100 |
| 2014 | $6,219 | $288,100 | $40,000 | $248,100 |
Source: Public Records
Map
Nearby Homes
- 3509 Hightimber Dr
- 3233 High Meadow Dr
- 3206 Wintergreen Terrace
- 3028 Mountainview Ct
- 3904 Wagon Wheel Dr
- 2618 Pointe Ct
- 3020 Northview Dr
- 3400 Wt Parr Rd
- 3205 Bridle Ln
- 3502 Fieldwood St
- 5809 N Ballantrae Dr
- 3218 Mapleridge Dr
- 3920 Kelsey Ct
- 3446 Spring Willow Dr
- 4147 Cedar Dr
- 2817 Kingswood Dr
- 2304 Woodmoor Ln
- 4151 Cedar Dr
- 4150 Cedar Dr
- 2902 Summertree Ln
- 3333 Barberry Rd
- 3357 Barberry Rd
- 3308 Rolling Hills Ln
- 3319 Barberry Rd
- 3424 Blueberry Ln
- 3218 Rolling Hills Ln
- 3404 Rolling Hills Ln
- 3411 Barberry Rd
- 3432 Wintergreen Terrace
- 3426 Blueberry Ln
- 3307 Barberry Rd
- 3410 Barberry Rd
- 3408 Rolling Hills Ln
- 3421 Barberry Rd
- 3212 Rolling Hills Ln
- 3416 Wintergreen Terrace
- 3433 Wintergreen Terrace
- 3309 Rolling Hills Ln
- 3301 Barberry Rd
- 3438 Blueberry Ln
Your Personal Tour Guide
Ask me questions while you tour the home.