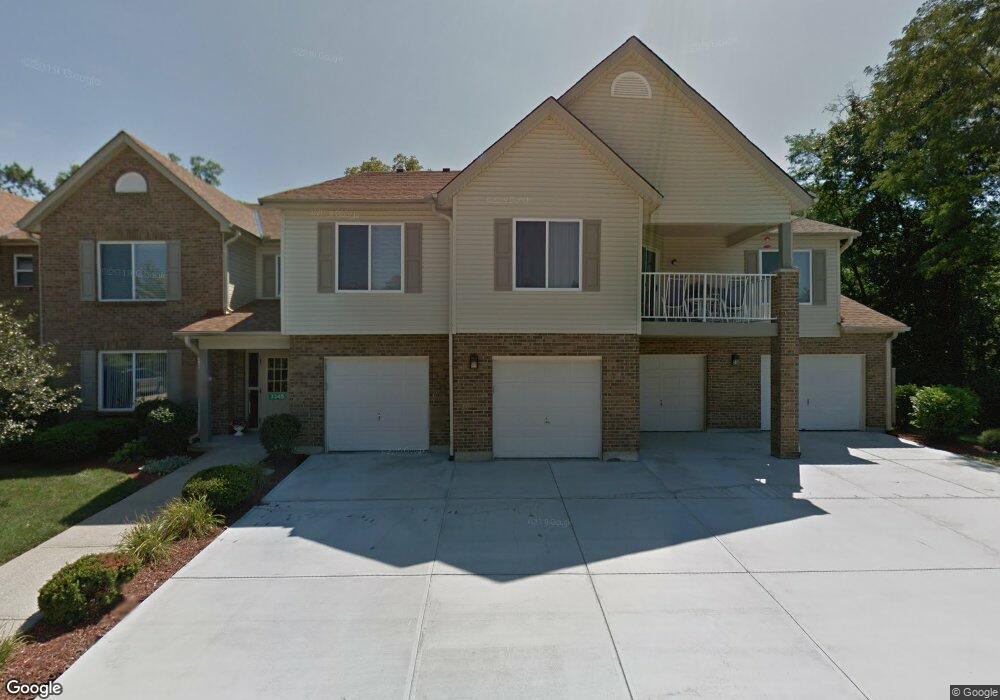
3345 Lindsay Ln Cincinnati, OH 45251
Estimated Value: $145,000 - $168,728
2
Beds
2
Baths
1,252
Sq Ft
$127/Sq Ft
Est. Value
About This Home
This home is located at 3345 Lindsay Ln, Cincinnati, OH 45251 and is currently estimated at $158,932, approximately $126 per square foot. 3345 Lindsay Ln is a home located in Hamilton County with nearby schools including Taylor Elementary School, Pleasant Run Elementary School, and Pleasant Run Middle School.
Ownership History
Date
Name
Owned For
Owner Type
Purchase Details
Closed on
Jan 10, 2020
Sold by
Niehaus Theresa L and Estate Of Alma Jean Panzeca
Bought by
Midkiff Karen
Current Estimated Value
Home Financials for this Owner
Home Financials are based on the most recent Mortgage that was taken out on this home.
Original Mortgage
$97,375
Interest Rate
3.6%
Mortgage Type
New Conventional
Purchase Details
Closed on
Nov 9, 2018
Sold by
Grosshem Phyllis
Bought by
Panzeca Alma J
Home Financials for this Owner
Home Financials are based on the most recent Mortgage that was taken out on this home.
Original Mortgage
$55,000
Interest Rate
4.8%
Mortgage Type
Purchase Money Mortgage
Purchase Details
Closed on
Sep 11, 2012
Sold by
Matre John E and Matre David J
Bought by
Grossheim Phyllis
Purchase Details
Closed on
Jul 24, 2012
Sold by
Matre John H
Bought by
Matre John E and Matre David J
Purchase Details
Closed on
Jun 19, 1998
Sold by
Hilsinger Building & Development Corp
Bought by
Matre John H and Matre Barbara L
Create a Home Valuation Report for This Property
The Home Valuation Report is an in-depth analysis detailing your home's value as well as a comparison with similar homes in the area
Home Values in the Area
Average Home Value in this Area
Purchase History
| Date | Buyer | Sale Price | Title Company |
|---|---|---|---|
| Midkiff Karen | $102,500 | Ivy Pointe Title Llc | |
| Panzeca Alma J | $80,000 | None Available | |
| Grossheim Phyllis | $70,000 | Attorney | |
| Matre John E | -- | None Available | |
| Matre John H | $106,200 | -- |
Source: Public Records
Mortgage History
| Date | Status | Borrower | Loan Amount |
|---|---|---|---|
| Previous Owner | Midkiff Karen | $97,375 | |
| Previous Owner | Panzeca Alma J | $55,000 |
Source: Public Records
Tax History Compared to Growth
Tax History
| Year | Tax Paid | Tax Assessment Tax Assessment Total Assessment is a certain percentage of the fair market value that is determined by local assessors to be the total taxable value of land and additions on the property. | Land | Improvement |
|---|---|---|---|---|
| 2024 | $2,352 | $44,058 | $6,650 | $37,408 |
| 2023 | $2,366 | $44,058 | $6,650 | $37,408 |
| 2022 | $2,362 | $35,876 | $3,770 | $32,106 |
| 2021 | $2,341 | $35,876 | $3,770 | $32,106 |
| 2020 | $1,788 | $35,876 | $3,770 | $32,106 |
| 2019 | $1,018 | $23,195 | $3,168 | $20,027 |
| 2018 | $1,524 | $23,195 | $3,168 | $20,027 |
| 2017 | $1,464 | $23,195 | $3,168 | $20,027 |
| 2016 | $1,583 | $24,501 | $3,623 | $20,878 |
| 2015 | $1,576 | $24,501 | $3,623 | $20,878 |
| 2014 | $1,581 | $24,501 | $3,623 | $20,878 |
| 2013 | $1,991 | $32,421 | $5,250 | $27,171 |
Source: Public Records
Map
Nearby Homes
- 3225 Heritage Square Dr Unit 25
- 3225 Heritage Square Dr
- 9455 Willowgate Dr
- 3151 Birchway Dr Unit 3151
- 9446 Haddington Ct Unit 200
- 9446 Haddington Ct
- 9631 Crosley Farm Dr
- 9568 Woodstate Dr
- 9410 Haddington Ct
- 3207 Ainsworth Dr
- 3246 Ainsworth Dr
- 3202 Ainsworth Dr
- 3436 Amberway Ct
- 3450 Amberway Ct
- 3258 Lillwood Ln
- 9717 Loralinda Dr
- 3222 Deshler Dr
- 3374 Deshler Dr
- 3012 Laverne Dr
- 9828 Loralinda Dr
- 3345 Lindsay Ln Unit 57
- 3345 Lindsay Ln Unit 60
- 3345 Lindsay Ln
- 3345 Lindsay Ln
- 3345 Lindsay Ln
- 3345 Lindsay Ln
- 3345 Lindsay Ln Unit 61
- 3345 Lindsay Ln Unit 59
- 3345 Lindsay Ln Unit 58
- 3341 Lindsay Ln
- 3341 Lindsay Ln
- 3341 Lindsay Ln
- 3341 Lindsay Ln
- 3341 Lindsay Ln Unit 67
- 3341 Lindsay Ln Unit 64
- 3341 Lindsay Ln Unit 63
- 3341 Lindsay Ln Unit 65
- 3341 Lindsay Ln Unit 66
- 3341 Lindsay Ln Unit 68
- 3343 Hidden Creek Dr