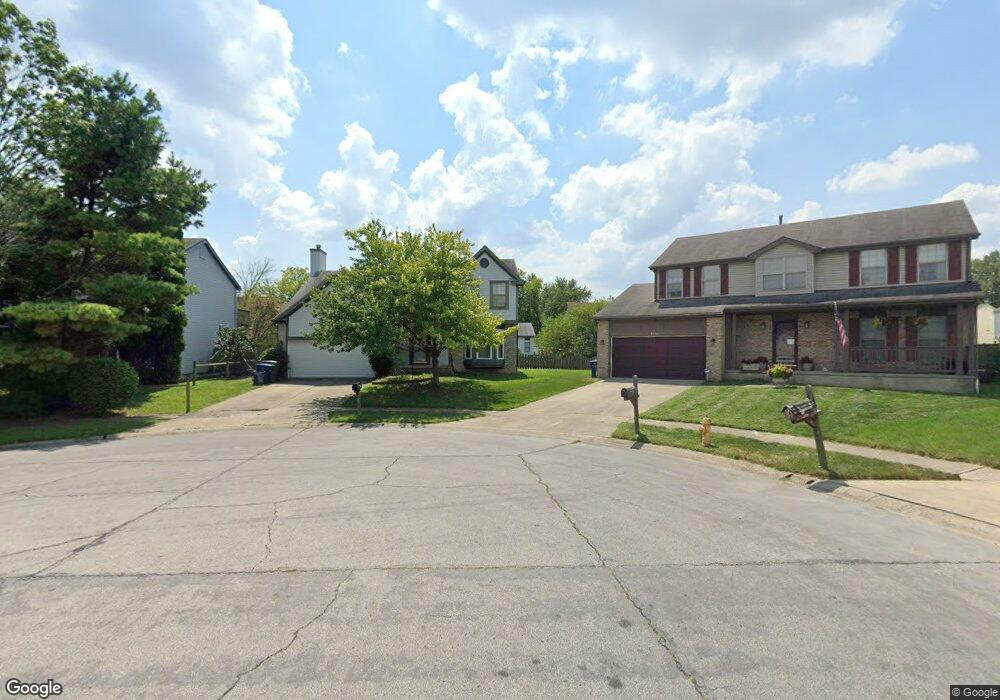
3345 Onslow Ct Columbus, OH 43204
Brookshire NeighborhoodEstimated Value: $288,063 - $301,000
4
Beds
3
Baths
1,804
Sq Ft
$163/Sq Ft
Est. Value
About This Home
This home is located at 3345 Onslow Ct, Columbus, OH 43204 and is currently estimated at $294,766, approximately $163 per square foot. 3345 Onslow Ct is a home located in Franklin County with nearby schools including West Franklin Elementary School, Franklin Woods Intermediate School, and Finland Middle School.
Ownership History
Date
Name
Owned For
Owner Type
Purchase Details
Closed on
Nov 9, 2004
Sold by
Reo Management 2002 Inc
Bought by
Silvis Jason R and Silvis Jacqueline M
Current Estimated Value
Home Financials for this Owner
Home Financials are based on the most recent Mortgage that was taken out on this home.
Original Mortgage
$136,918
Outstanding Balance
$66,784
Interest Rate
5.86%
Mortgage Type
FHA
Estimated Equity
$227,982
Purchase Details
Closed on
May 11, 2004
Sold by
Hockingberry Troy C and Wells Fargo Home Mortgage Inc
Bought by
Sfjv-2002-1 Llc
Purchase Details
Closed on
Sep 4, 1997
Sold by
Homewood Building Company
Bought by
Hockingberry Troy C and Hockingberry Michelle R
Home Financials for this Owner
Home Financials are based on the most recent Mortgage that was taken out on this home.
Original Mortgage
$126,650
Interest Rate
7.44%
Mortgage Type
FHA
Create a Home Valuation Report for This Property
The Home Valuation Report is an in-depth analysis detailing your home's value as well as a comparison with similar homes in the area
Home Values in the Area
Average Home Value in this Area
Purchase History
| Date | Buyer | Sale Price | Title Company |
|---|---|---|---|
| Silvis Jason R | $138,000 | Rels Title | |
| Reo Management 2002 Inc | -- | Rels Title | |
| Sfjv-2002-1 Llc | $105,000 | -- | |
| Hockingberry Troy C | $127,800 | Preferred Title Agency Inc |
Source: Public Records
Mortgage History
| Date | Status | Borrower | Loan Amount |
|---|---|---|---|
| Open | Silvis Jason R | $136,918 | |
| Previous Owner | Hockingberry Troy C | $126,650 |
Source: Public Records
Tax History
| Year | Tax Paid | Tax Assessment Tax Assessment Total Assessment is a certain percentage of the fair market value that is determined by local assessors to be the total taxable value of land and additions on the property. | Land | Improvement |
|---|---|---|---|---|
| 2025 | $3,349 | $91,850 | $23,350 | $68,500 |
| 2024 | $3,349 | $91,850 | $23,350 | $68,500 |
| 2023 | $3,290 | $91,840 | $23,345 | $68,495 |
| 2022 | $2,711 | $55,550 | $8,400 | $47,150 |
| 2021 | $2,766 | $55,550 | $8,400 | $47,150 |
| 2020 | $2,750 | $55,550 | $8,400 | $47,150 |
| 2019 | $2,541 | $45,290 | $7,000 | $38,290 |
| 2018 | $2,555 | $45,290 | $7,000 | $38,290 |
| 2017 | $2,517 | $45,290 | $7,000 | $38,290 |
| 2016 | $2,582 | $42,670 | $7,110 | $35,560 |
| 2015 | $2,582 | $42,670 | $7,110 | $35,560 |
| 2014 | $2,584 | $42,670 | $7,110 | $35,560 |
| 2013 | $1,424 | $47,390 | $7,875 | $39,515 |
Source: Public Records
Map
Nearby Homes
- 3318 Miriam Dr S
- 1638 Tall Meadows Dr
- 3340 Miriam Dr S
- 988 S Roys Ave
- 2937 Rundell Dr
- 1605 Greenville Rd
- 3029 Rosedale Ave
- 3407 Western Hill Rd
- 3664-3670 Mccarley Dr S
- 894 Binns Blvd
- 840 Mark Place
- 1657 Ripplebrook Rd
- 2856 Chesfield Dr
- 3551 Glorious Rd
- 814 Miriam Dr W
- 1147 Parma Ave
- 1175-1177 Mccarley Dr S
- 1490 Demorest Rd
- 793 Binns Blvd
- 1722 Hollow Run Dr
- 3339 Onslow Ct
- 3351 Onslow Ct
- 3366 Riegelwood Ct
- 3360 Riegelwood Ct
- 3372 Riegelwood Ct
- 3352 Riegelwood Ct
- 3333 Onslow Ct
- 3357 Onslow Ct
- 3378 Riegelwood Ct
- 3327 Onslow Ct
- 1256 Riegelwood Ln
- 1248 Riegelwood Ln
- 3344 Riegelwood Ct
- 1264 Riegelwood Ln
- 3342 Onslow Ct
- 3354 Onslow Ct
- 1240 Riegelwood Ln
- 3348 Onslow Ct
- 3384 Riegelwood Ct
- 3336 Onslow Ct
Your Personal Tour Guide
Ask me questions while you tour the home.