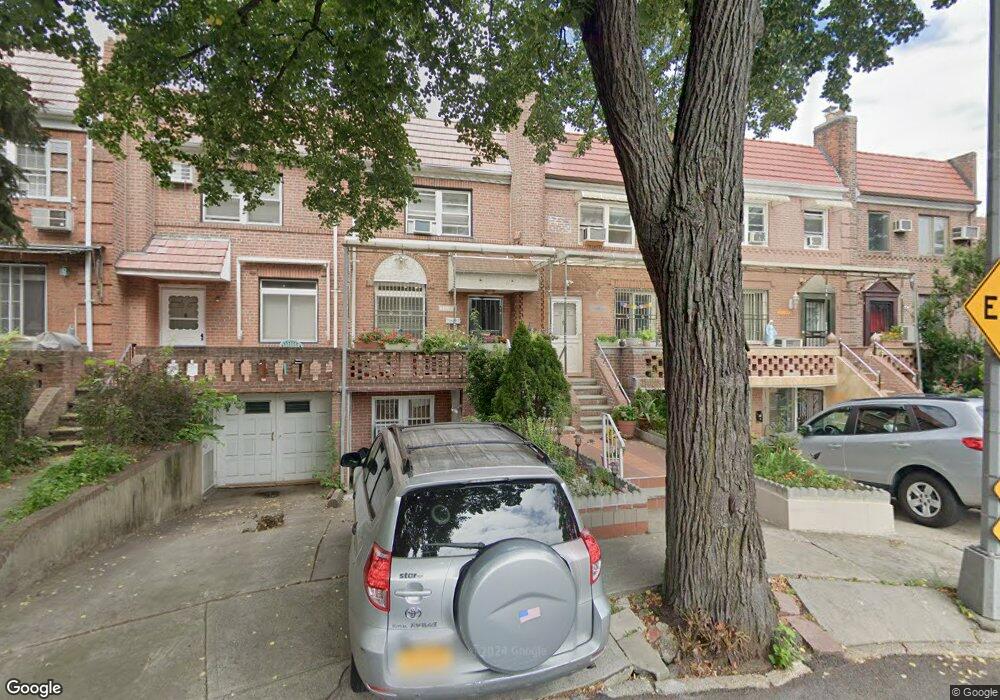
3347 60th Place Woodside, NY 11377
Woodside NeighborhoodEstimated Value: $941,000 - $1,003,000
--
Bed
--
Bath
1,280
Sq Ft
$761/Sq Ft
Est. Value
About This Home
This home is located at 3347 60th Place, Woodside, NY 11377 and is currently estimated at $974,114, approximately $761 per square foot. 3347 60th Place is a home located in Queens County with nearby schools including Ps 152 Gwendolyn N Alleyne School, I.S. 010 Horace Greeley, and William Cullen Bryant High School.
Ownership History
Date
Name
Owned For
Owner Type
Purchase Details
Closed on
Aug 19, 2017
Sold by
Dorjee Tsedup and Gyatso Jigme
Bought by
Gyatso Dickyi and Gyatso Jigme
Current Estimated Value
Purchase Details
Closed on
Dec 4, 2009
Sold by
Tartaglia Luz Elena and Tartaglia Osvaldo
Bought by
Dorjee Tsedup and Gyatso Jigme
Home Financials for this Owner
Home Financials are based on the most recent Mortgage that was taken out on this home.
Original Mortgage
$312,000
Interest Rate
5%
Mortgage Type
Purchase Money Mortgage
Purchase Details
Closed on
Mar 29, 2004
Sold by
Yam Albertina and Yam Richi Tina Grace
Bought by
Tartaglia Luz Elena and Tartaglia Osvaldo
Home Financials for this Owner
Home Financials are based on the most recent Mortgage that was taken out on this home.
Original Mortgage
$312,000
Interest Rate
5.6%
Mortgage Type
Purchase Money Mortgage
Create a Home Valuation Report for This Property
The Home Valuation Report is an in-depth analysis detailing your home's value as well as a comparison with similar homes in the area
Home Values in the Area
Average Home Value in this Area
Purchase History
| Date | Buyer | Sale Price | Title Company |
|---|---|---|---|
| Gyatso Dickyi | -- | -- | |
| Dorjee Tsedup | $480,000 | -- | |
| Tartaglia Luz Elena | $390,000 | -- |
Source: Public Records
Mortgage History
| Date | Status | Borrower | Loan Amount |
|---|---|---|---|
| Previous Owner | Dorjee Tsedup | $312,000 | |
| Previous Owner | Tartaglia Luz Elena | $312,000 |
Source: Public Records
Tax History Compared to Growth
Tax History
| Year | Tax Paid | Tax Assessment Tax Assessment Total Assessment is a certain percentage of the fair market value that is determined by local assessors to be the total taxable value of land and additions on the property. | Land | Improvement |
|---|---|---|---|---|
| 2025 | $7,037 | $37,132 | $9,380 | $27,752 |
| 2024 | $7,037 | $35,035 | $9,836 | $25,199 |
| 2023 | $7,037 | $35,035 | $9,951 | $25,084 |
| 2022 | $6,940 | $52,200 | $14,520 | $37,680 |
| 2021 | $6,903 | $48,660 | $14,520 | $34,140 |
| 2020 | $6,550 | $47,580 | $14,520 | $33,060 |
| 2019 | $6,108 | $52,380 | $14,520 | $37,860 |
| 2018 | $5,952 | $29,196 | $11,507 | $17,689 |
| 2017 | $5,906 | $28,972 | $11,570 | $17,402 |
| 2016 | $5,464 | $28,972 | $11,570 | $17,402 |
| 2015 | $3,297 | $25,786 | $12,001 | $13,785 |
| 2014 | $3,297 | $24,330 | $12,909 | $11,421 |
Source: Public Records
Map
Nearby Homes
- 33-30 61st St Unit 306
- 60-11 Broadway Unit 3L
- 60-11 Broadway Unit 6
- 60-11 Broadway Unit 3C
- 60-11 Broadway Unit 3S
- 6011 Broadway Unit 1M
- 34-34 62nd St
- 34-43 60 St Unit 4L
- 34-43 60 St Unit 2B
- 34-43 60 St Unit 4J
- 34-43 60th St Unit 5B
- 3443 60th St Unit 1K
- 34-33 62nd St
- 34-55 60th St
- 34-29 58th St
- 34-29 64th St
- 63-02 Broadway
- 33-42 70th St
- 37-43 58th St
- 3134 68th St
- 3349 60th Place
- 3349 60th Place
- 3349 60th Place
- 33-51 60th Place
- 3351 60th Place
- 3345 60th Place
- 3343 60th Place
- 3341 60th Place
- 3342 61st St
- 3340 61st St
- 3344 61st St
- 3338 61st St
- 3339 60th Place
- 3344 61st St
- 3344 61st St Unit 1 Fl.
- 3344 61st St Unit 2 Fl.
- 3346 61st St
- 3348 61st St
- 3350 61st St
- 3337 60th St