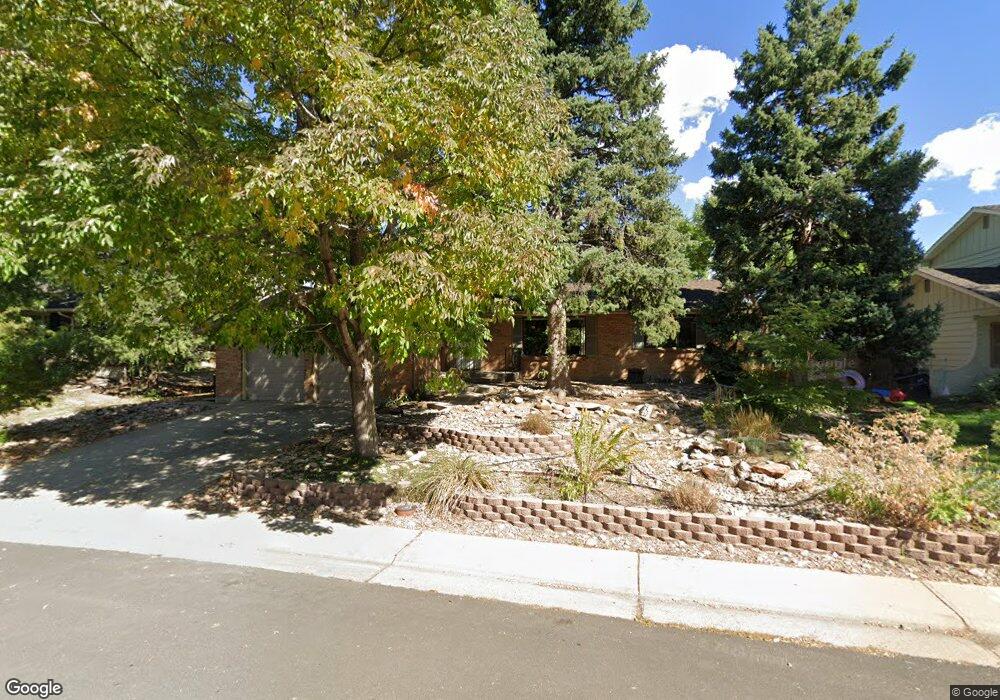
3348 S Dayton Ct Denver, CO 80231
Hampden NeighborhoodEstimated Value: $649,000 - $729,000
4
Beds
3
Baths
1,899
Sq Ft
$353/Sq Ft
Est. Value
About This Home
This home is located at 3348 S Dayton Ct, Denver, CO 80231 and is currently estimated at $670,369, approximately $353 per square foot. 3348 S Dayton Ct is a home located in Denver County with nearby schools including Joe Shoemaker School, Holm Elementary School, and Samuels Elementary School.
Ownership History
Date
Name
Owned For
Owner Type
Purchase Details
Closed on
Mar 8, 2022
Sold by
Hatfield Sonia H
Bought by
Taylor Ryan and Taylor Katelyn
Current Estimated Value
Home Financials for this Owner
Home Financials are based on the most recent Mortgage that was taken out on this home.
Original Mortgage
$627,750
Outstanding Balance
$586,521
Interest Rate
3.92%
Mortgage Type
New Conventional
Estimated Equity
$83,848
Purchase Details
Closed on
Dec 21, 2020
Sold by
Farrell Lisa A
Bought by
Hatfield Soniah and Puglisi Richard L
Home Financials for this Owner
Home Financials are based on the most recent Mortgage that was taken out on this home.
Original Mortgage
$501,300
Interest Rate
2.7%
Mortgage Type
New Conventional
Purchase Details
Closed on
Sep 30, 2004
Sold by
Nelson Randall K and Nelson Xuan Thao Tran
Bought by
Farrell Lisa A
Home Financials for this Owner
Home Financials are based on the most recent Mortgage that was taken out on this home.
Original Mortgage
$247,400
Interest Rate
5.71%
Mortgage Type
Purchase Money Mortgage
Create a Home Valuation Report for This Property
The Home Valuation Report is an in-depth analysis detailing your home's value as well as a comparison with similar homes in the area
Home Values in the Area
Average Home Value in this Area
Purchase History
| Date | Buyer | Sale Price | Title Company |
|---|---|---|---|
| Taylor Ryan | $697,500 | New Title Company Name | |
| Hatfield Soniah | $563,000 | Canyon Title | |
| Farrell Lisa A | $267,400 | Land Title Guarantee Company |
Source: Public Records
Mortgage History
| Date | Status | Borrower | Loan Amount |
|---|---|---|---|
| Open | Taylor Ryan | $627,750 | |
| Previous Owner | Hatfield Soniah | $501,300 | |
| Previous Owner | Farrell Lisa A | $247,400 |
Source: Public Records
Tax History Compared to Growth
Tax History
| Year | Tax Paid | Tax Assessment Tax Assessment Total Assessment is a certain percentage of the fair market value that is determined by local assessors to be the total taxable value of land and additions on the property. | Land | Improvement |
|---|---|---|---|---|
| 2024 | $3,378 | $42,650 | $9,940 | $32,710 |
| 2023 | $3,305 | $42,650 | $9,940 | $32,710 |
| 2022 | $2,593 | $32,610 | $14,130 | $18,480 |
| 2021 | $2,503 | $33,550 | $14,540 | $19,010 |
| 2020 | $2,230 | $30,060 | $14,540 | $15,520 |
| 2019 | $2,168 | $30,060 | $14,540 | $15,520 |
| 2018 | $2,313 | $29,900 | $14,640 | $15,260 |
| 2017 | $2,306 | $29,900 | $14,640 | $15,260 |
| 2016 | $2,285 | $28,020 | $12,776 | $15,244 |
| 2015 | $2,189 | $28,020 | $12,776 | $15,244 |
| 2014 | $1,912 | $23,020 | $7,164 | $15,856 |
Source: Public Records
Map
Nearby Homes
- 3320 S Fulton Ct
- 3404 S Clinton Ct
- 3309 S Galena Ct
- 3158 S Dayton Ct
- 3062 S Florence Ct
- 9424 E Girard Ave
- 9230 E Girard Ave Unit 7
- 9440 E Girard Ave Unit 1
- 9004 E Floyd Ave
- 3751 S Dayton St
- 3768 S Dallas St
- 2777 S Elmira St Unit 10
- 2770 S Elmira St Unit 157
- 10000 E Yale Ave Unit 55
- 10000 E Yale Ave Unit 57
- 10000 E Yale Ave Unit 58
- 10000 E Yale Ave Unit 41
- 3852 S Dallas St Unit 8107
- 9200 E Cherry Creek Dr S Unit 8
- 2685 S Dayton Way Unit 282
- 3328 S Dayton Ct
- 3358 S Dayton Ct
- 3339 S Dayton Ct
- 3368 S Dayton Ct
- 3359 S Dayton Ct
- 3319 S Dayton Ct
- 3377 S Emporia Ct
- 3397 S Emporia Ct
- 3357 S Emporia Ct
- 3379 S Dayton Ct
- 3388 S Dayton Ct
- 3309 S Dayton Ct
- 3308 S Dayton Ct
- 3337 S Emporia Ct
- 3310 S Dayton St
- 3396 S Emporia Ct
- 3320 S Dayton St
- 3399 S Dayton Ct
- 3317 S Emporia Ct
- 3398 S Dayton Ct