Estimated Value: $270,808 - $318,000
4
Beds
3
Baths
1,948
Sq Ft
$149/Sq Ft
Est. Value
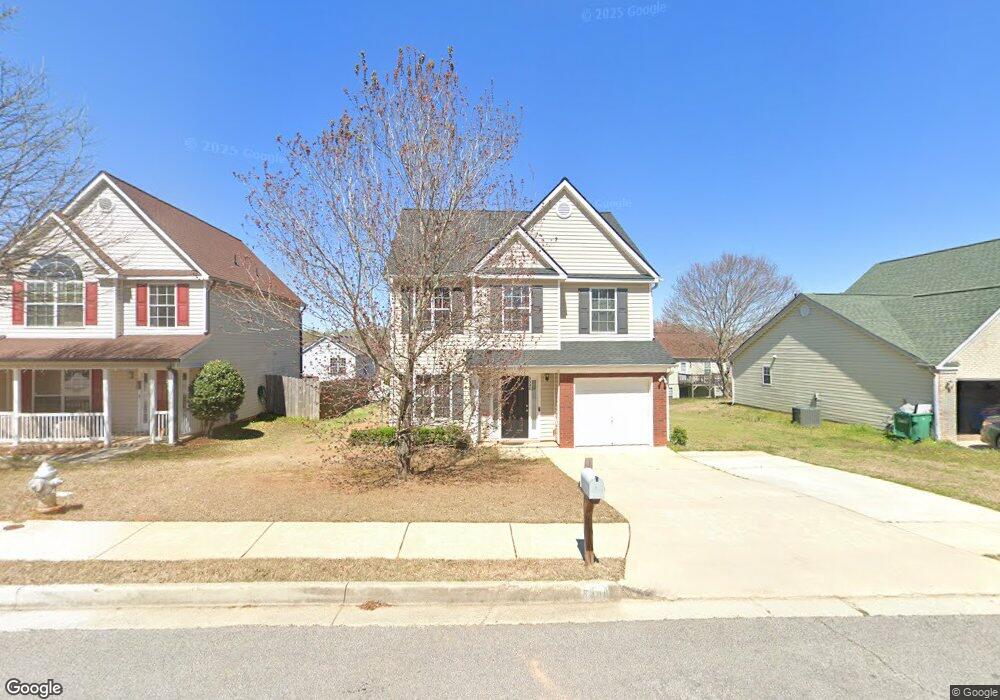
About This Home
This home is located at 3348 Waggoner Ln, Rex, GA 30273 and is currently estimated at $290,202, approximately $148 per square foot. 3348 Waggoner Ln is a home located in Clayton County with nearby schools including East Clayton Elementary School, Adamson Middle School, and Morrow High School.
Ownership History
Date
Name
Owned For
Owner Type
Purchase Details
Closed on
Feb 17, 2011
Sold by
Renewal Works Llc
Bought by
Fowler Cerina R
Current Estimated Value
Home Financials for this Owner
Home Financials are based on the most recent Mortgage that was taken out on this home.
Original Mortgage
$87,425
Outstanding Balance
$60,078
Interest Rate
4.87%
Mortgage Type
FHA
Estimated Equity
$230,124
Purchase Details
Closed on
Aug 4, 2009
Sold by
Gt Architecture Contractors
Bought by
Rbc Real Estate Finance Inc
Purchase Details
Closed on
Mar 1, 2006
Sold by
Southside Dev Inc
Bought by
Gt Architecture Contractors Co
Home Financials for this Owner
Home Financials are based on the most recent Mortgage that was taken out on this home.
Original Mortgage
$908,936
Interest Rate
6.19%
Purchase Details
Closed on
Oct 10, 2004
Sold by
Southside Dev Inc
Bought by
Gt Architecture Contrctors Corp
Home Financials for this Owner
Home Financials are based on the most recent Mortgage that was taken out on this home.
Original Mortgage
$506,212
Interest Rate
5.64%
Create a Home Valuation Report for This Property
The Home Valuation Report is an in-depth analysis detailing your home's value as well as a comparison with similar homes in the area
Home Values in the Area
Average Home Value in this Area
Purchase History
| Date | Buyer | Sale Price | Title Company |
|---|---|---|---|
| Fowler Cerina R | $89,700 | -- | |
| Rbc Real Estate Finance Inc | $137,776 | -- | |
| Gt Architecture Contractors Co | $320,000 | -- | |
| Gt Architecture Contrctors Corp | $170,000 | -- |
Source: Public Records
Mortgage History
| Date | Status | Borrower | Loan Amount |
|---|---|---|---|
| Open | Fowler Cerina R | $87,425 | |
| Previous Owner | Gt Architecture Contractors Co | $908,936 | |
| Previous Owner | Gt Architecture Contrctors Corp | $506,212 |
Source: Public Records
Tax History Compared to Growth
Tax History
| Year | Tax Paid | Tax Assessment Tax Assessment Total Assessment is a certain percentage of the fair market value that is determined by local assessors to be the total taxable value of land and additions on the property. | Land | Improvement |
|---|---|---|---|---|
| 2024 | $3,902 | $109,040 | $8,800 | $100,240 |
| 2023 | $3,872 | $107,240 | $8,800 | $98,440 |
| 2022 | $3,088 | $87,720 | $8,800 | $78,920 |
| 2021 | $2,356 | $68,680 | $8,800 | $59,880 |
| 2020 | $2,158 | $63,010 | $8,800 | $54,210 |
| 2019 | $1,817 | $53,818 | $8,800 | $45,018 |
| 2018 | $1,553 | $47,320 | $8,800 | $38,520 |
| 2017 | $1,291 | $40,804 | $8,800 | $32,004 |
| 2016 | $899 | $31,152 | $8,800 | $22,352 |
| 2015 | $791 | $0 | $0 | $0 |
| 2014 | $760 | $28,137 | $9,600 | $18,537 |
Source: Public Records
Map
Nearby Homes
- 3456 Heartland Dr Unit 2
- 3548 Meadowview Ct
- 3130 Rex Ridge Cir
- 6061 Tina Ln
- 5810 Mistyview Dr Unit 3
- 5652 Laney Dr
- 6139 Katherine Rd
- 6103 Chaseland Dr
- 6103 Chaseland Rd
- 6057 Dorchester Dr
- 5705 Laney Dr
- 5631 Laney Dr
- 3694 Rex Rd
- 5861 Colonnade Dr
- 5610 Swanson Rd
- 3078 Caliente Ln
- 3645 Fay Dr Unit 1
- 5578 Swanson Rd
- 3709 Charlotte Dr
- 3203 Pawnee Dr
- 3342 Waggoner Ln
- 3354 Waggoner Ln
- 3355 Waggoner Way
- 0 Waggoner Ln Unit 3212809
- 0 Waggoner Ln Unit 7311330
- 3361 Waggoner Way
- 3349 Waggoner Way
- 3336 Waggoner Ln
- 3360 Waggoner Ln
- 3347 Waggoner Ln
- 3343 Waggoner Way
- 3341 Waggoner Ln
- 3353 Waggoner Ln
- 3367 Waggoner Way
- 3330 Waggoner Ln
- 3366 Waggoner Ln
- 3335 Waggoner Ln
- 3359 Waggoner Ln
- 3337 Waggoner Way
- 0 Waggoner Way Unit 8814781