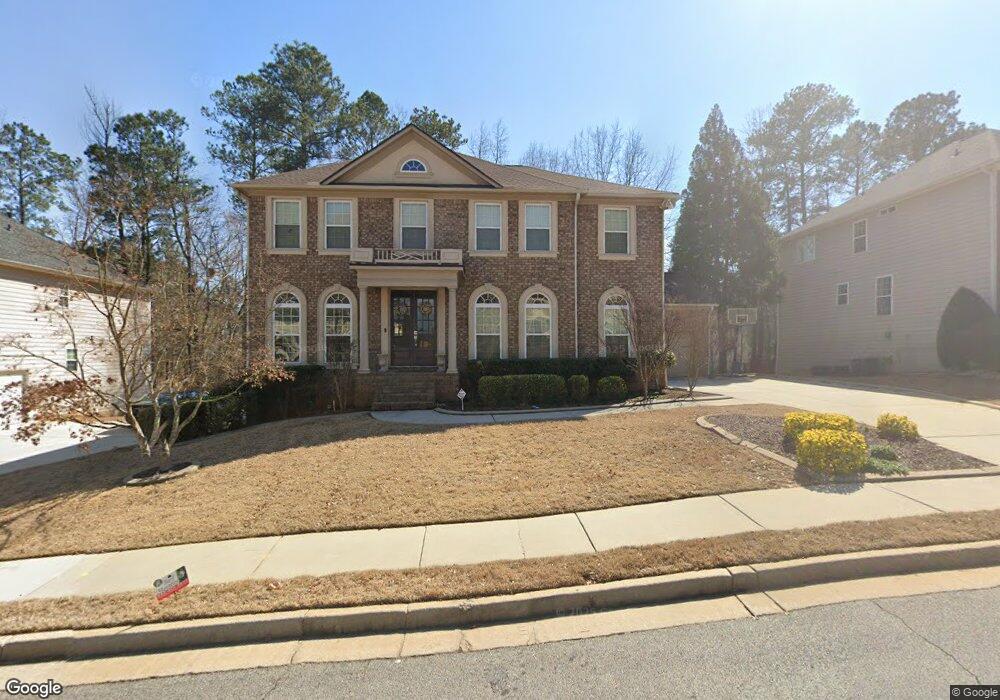
3348 Walnut Ridge Atlanta, GA 30349
Estimated Value: $467,879 - $547,000
5
Beds
3
Baths
3,642
Sq Ft
$140/Sq Ft
Est. Value
About This Home
This home is located at 3348 Walnut Ridge, Atlanta, GA 30349 and is currently estimated at $510,220, approximately $140 per square foot. 3348 Walnut Ridge is a home located in Fulton County with nearby schools including Stonewall Tell Elementary School, Sandtown Middle School, and Westlake High School.
Ownership History
Date
Name
Owned For
Owner Type
Purchase Details
Closed on
Sep 29, 2008
Sold by
Opteum Mtg Acceptance Corp 20
Bought by
Touchard Andre G and Touchard Kenya
Current Estimated Value
Home Financials for this Owner
Home Financials are based on the most recent Mortgage that was taken out on this home.
Original Mortgage
$258,249
Outstanding Balance
$169,070
Interest Rate
6.11%
Mortgage Type
FHA
Estimated Equity
$341,150
Purchase Details
Closed on
Nov 6, 2007
Sold by
Storr Christian
Bought by
Opteum Mtg Acceptance Corp Ass
Purchase Details
Closed on
Jan 25, 2005
Sold by
Storr Christian
Bought by
Storr Christian
Home Financials for this Owner
Home Financials are based on the most recent Mortgage that was taken out on this home.
Original Mortgage
$268,250
Interest Rate
5.88%
Mortgage Type
New Conventional
Create a Home Valuation Report for This Property
The Home Valuation Report is an in-depth analysis detailing your home's value as well as a comparison with similar homes in the area
Home Values in the Area
Average Home Value in this Area
Purchase History
| Date | Buyer | Sale Price | Title Company |
|---|---|---|---|
| Touchard Andre G | $263,000 | -- | |
| Opteum Mtg Acceptance Corp Ass | $282,899 | -- | |
| Storr Christian | -- | -- | |
| Storr Christian | $335,400 | -- |
Source: Public Records
Mortgage History
| Date | Status | Borrower | Loan Amount |
|---|---|---|---|
| Open | Touchard Andre G | $258,249 | |
| Previous Owner | Storr Christian | $268,250 |
Source: Public Records
Tax History Compared to Growth
Tax History
| Year | Tax Paid | Tax Assessment Tax Assessment Total Assessment is a certain percentage of the fair market value that is determined by local assessors to be the total taxable value of land and additions on the property. | Land | Improvement |
|---|---|---|---|---|
| 2025 | $4,611 | $172,960 | $41,560 | $131,400 |
| 2023 | $4,898 | $173,520 | $32,640 | $140,880 |
| 2022 | $4,247 | $146,000 | $27,760 | $118,240 |
| 2021 | $4,085 | $130,160 | $26,960 | $103,200 |
| 2020 | $3,859 | $112,440 | $23,800 | $88,640 |
| 2019 | $3,633 | $109,200 | $22,160 | $87,040 |
| 2018 | $3,796 | $112,680 | $21,640 | $91,040 |
| 2017 | $3,751 | $109,120 | $14,760 | $94,360 |
| 2016 | $3,750 | $109,120 | $14,760 | $94,360 |
| 2015 | $3,761 | $109,120 | $14,760 | $94,360 |
| 2014 | $2,573 | $77,400 | $14,400 | $63,000 |
Source: Public Records
Map
Nearby Homes
- 3346 Sequoia Ave
- 3409 Walnut Ridge
- 6057 Glencedar Ln
- 3295 Stonewall Tell
- 132 Wolf View Ct SW
- 102 Red Wolf Ct
- 3465 Stonewall Tell Rd
- 736 Red Wolf Run
- 2600 Wolf Lake Dr SW
- 3150 Stonewall Tell Rd
- 3123 Wolf Club Dr SW
- 2552 Wolf Den Ln
- 6505 Cherie Ln
- 6505 Cherie Ln SW
- 870 Clifton Springs Close Dr
- 5700 Miles Rd
- 6500 Shannonlore Dr SW
- 6500 Shannonlore Dr
- 419 Woodmill Way SW
- 6070 Marigold Way
- 3352 Walnut Ridge Unit 3A
- 3344 Walnut Ridge Unit 3A
- 3340 Walnut Ridge
- 3358 Walnut Ridge
- 3345 Walnut Ridge Unit 3A
- 3349 Walnut Ridge Unit 3A
- 3330 Arbor Run Place Unit 1B
- 3341 Walnut Ridge Unit 3A
- 3340 Arbor Run Place
- 3353 Walnut Ridge
- 3310 Arbor Run Place
- 3336 Walnut Ridge Unit 3A
- 3376 Walnut Ridge
- 3320 Arbor Run Place Unit 1
- 3320 Arbor Run Place
- 3320 Arbor Run Place Unit 1B
- 3337 Walnut Ridge Unit 3A
- 3357 Walnut Ridge
- 3357 Walnut Ridge Unit 3A
- 3380 Walnut Ridge