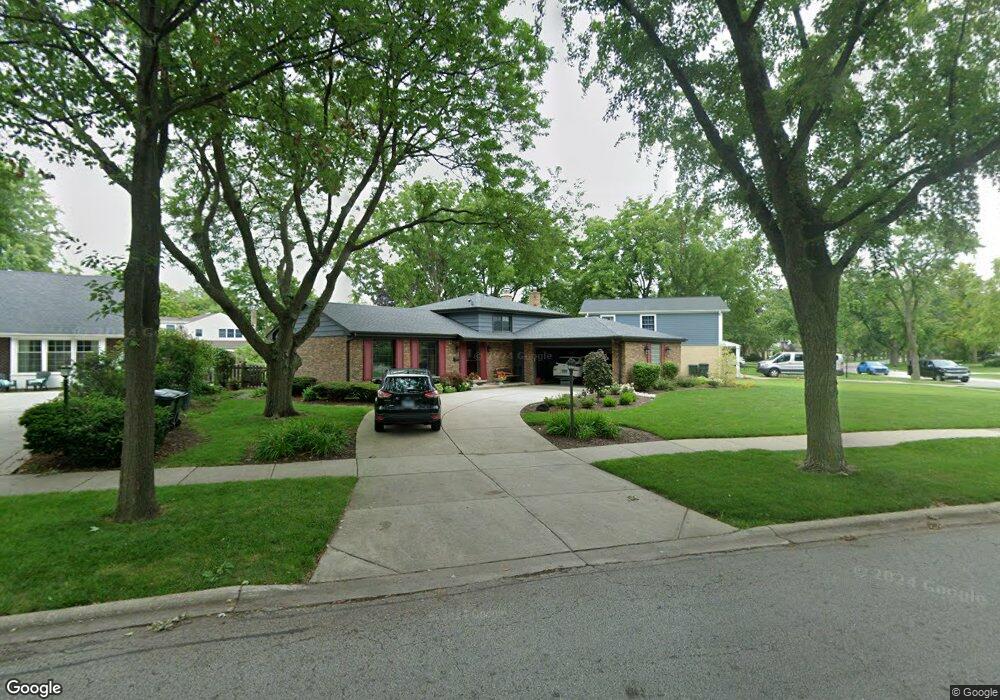
3349 Maple Leaf Dr Glenview, IL 60026
The Willows NeighborhoodEstimated Value: $504,000 - $691,000
3
Beds
2
Baths
1,282
Sq Ft
$474/Sq Ft
Est. Value
About This Home
This home is located at 3349 Maple Leaf Dr, Glenview, IL 60026 and is currently estimated at $607,111, approximately $473 per square foot. 3349 Maple Leaf Dr is a home located in Cook County with nearby schools including Willowbrook Elementary School, Maple School, and Glenbrook South High School.
Ownership History
Date
Name
Owned For
Owner Type
Purchase Details
Closed on
Jan 15, 2013
Sold by
Schwabe George J and Schwabe Lynn D
Bought by
Schwabe George J and Schwabe Lynn A
Current Estimated Value
Home Financials for this Owner
Home Financials are based on the most recent Mortgage that was taken out on this home.
Original Mortgage
$310,000
Interest Rate
3.62%
Mortgage Type
New Conventional
Purchase Details
Closed on
Sep 10, 2009
Sold by
Schwabe Lynn D and Schwabe Lynn A
Bought by
Schwabe George J and Schwabe Lynn D
Purchase Details
Closed on
Jun 21, 2004
Sold by
Schwabe George J
Bought by
Schwabe Lynn A
Home Financials for this Owner
Home Financials are based on the most recent Mortgage that was taken out on this home.
Original Mortgage
$295,000
Interest Rate
6.42%
Mortgage Type
New Conventional
Create a Home Valuation Report for This Property
The Home Valuation Report is an in-depth analysis detailing your home's value as well as a comparison with similar homes in the area
Home Values in the Area
Average Home Value in this Area
Purchase History
| Date | Buyer | Sale Price | Title Company |
|---|---|---|---|
| Schwabe George J | -- | Near North National Title | |
| Schwabe George J | -- | None Available | |
| Schwabe Lynn A | -- | Chicago Title Insurance Comp |
Source: Public Records
Mortgage History
| Date | Status | Borrower | Loan Amount |
|---|---|---|---|
| Closed | Schwabe George J | $310,000 | |
| Closed | Schwabe Lynn A | $295,000 |
Source: Public Records
Tax History
| Year | Tax Paid | Tax Assessment Tax Assessment Total Assessment is a certain percentage of the fair market value that is determined by local assessors to be the total taxable value of land and additions on the property. | Land | Improvement |
|---|---|---|---|---|
| 2025 | $9,737 | $54,000 | $19,536 | $34,464 |
| 2024 | $9,737 | $48,000 | $16,576 | $31,424 |
| 2023 | $9,451 | $48,000 | $16,576 | $31,424 |
| 2022 | $9,451 | $48,000 | $16,576 | $31,424 |
| 2021 | $8,365 | $38,686 | $13,912 | $24,774 |
| 2020 | $8,356 | $38,686 | $13,912 | $24,774 |
| 2019 | $8,611 | $42,513 | $13,912 | $28,601 |
| 2018 | $7,969 | $36,366 | $12,136 | $24,230 |
| 2017 | $7,823 | $36,366 | $12,136 | $24,230 |
| 2016 | $7,304 | $36,366 | $12,136 | $24,230 |
| 2015 | $6,196 | $28,344 | $9,768 | $18,576 |
| 2014 | $6,095 | $28,344 | $9,768 | $18,576 |
| 2013 | $6,001 | $28,344 | $9,768 | $18,576 |
Source: Public Records
Map
Nearby Homes
- 3820 Kiess Dr
- 2431 Cobblewood Dr Unit 9
- 2137 Dauntless Dr
- 3800 Kiess Dr
- 2571 Essex Dr
- 102 Yale Ct Unit 34LH10
- 2050 Valencia Dr Unit 300C
- 2050 Valencia Dr Unit 405C
- 1605 Elmdale Ave
- 1615 Greenwood Rd
- 3190 Landwehr Rd
- 3005 Highland Rd
- 3246 Landwehr Rd Unit 3
- 2230 Goldenrod Ln
- 3240 Brookdale Ln
- 3256 Westview Dr
- 3849 Grace Ln
- 1867 Admiral Ct Unit 91
- 3255 Westview Dr
- 2803 Wildflower Ct
- 2317 Strawberry Ln
- 3343 Maple Leaf Dr
- 2311 Strawberry Ln
- 3337 Maple Leaf Dr
- 2324 Greenwood Rd
- 2318 Greenwood Rd
- 3346 Maple Leaf Dr
- 2330 Greenwood Rd
- 3340 Maple Leaf Dr
- 2312 Strawberry Ln
- 2305 Strawberry Ln
- 2312 Greenwood Rd
- 3331 Maple Leaf Dr
- 3404 Maple Leaf Dr
- 2306 Strawberry Ln
- 2336 Greenwood Rd
- 3336 Maple Leaf Dr
- 2304 Greenwood Rd Unit 1
- 2344 Greenwood Rd
- 2251 Strawberry Ln
Your Personal Tour Guide
Ask me questions while you tour the home.