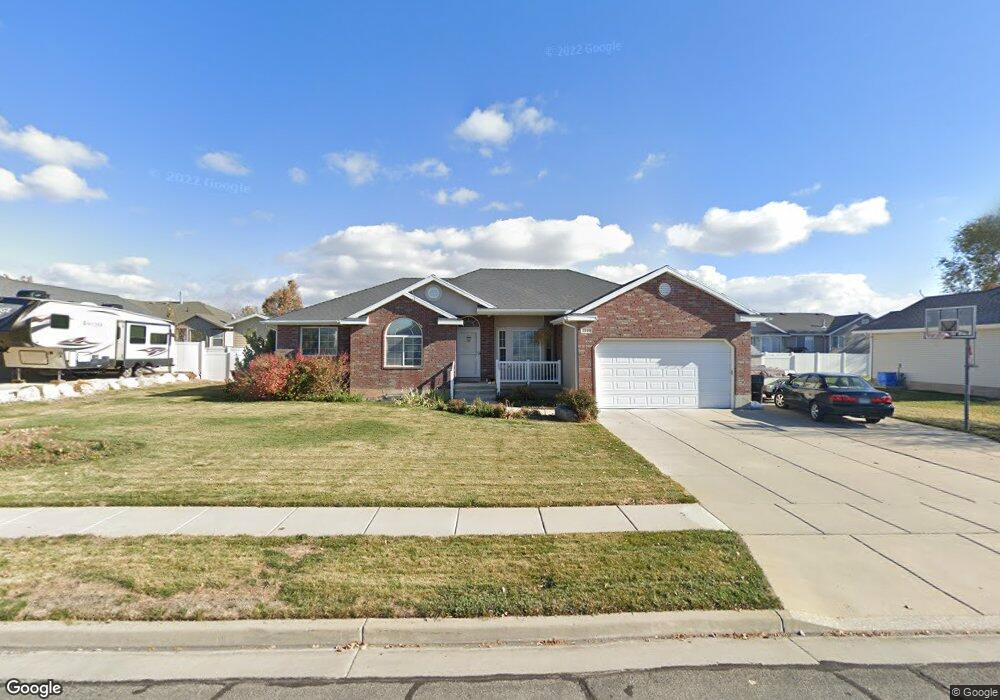
3349 S 575 W Syracuse, UT 84075
Estimated Value: $602,000 - $669,000
--
Bed
4
Baths
1,576
Sq Ft
$405/Sq Ft
Est. Value
About This Home
This home is located at 3349 S 575 W, Syracuse, UT 84075 and is currently estimated at $637,754, approximately $404 per square foot. 3349 S 575 W is a home located in Davis County with nearby schools including Legacy Junior High School, Clearfield High School, and North Davis Preparatory Academy.
Ownership History
Date
Name
Owned For
Owner Type
Purchase Details
Closed on
Jun 8, 2009
Sold by
Griffin Aaron L and Griffin Peri L
Bought by
Griffin Aaron L and Griffin Peri
Current Estimated Value
Home Financials for this Owner
Home Financials are based on the most recent Mortgage that was taken out on this home.
Original Mortgage
$164,000
Outstanding Balance
$103,116
Interest Rate
4.76%
Mortgage Type
New Conventional
Estimated Equity
$534,638
Purchase Details
Closed on
Aug 31, 2001
Sold by
Stevenson Bob
Bought by
Griffin Aaron L and Griffin Peri L
Home Financials for this Owner
Home Financials are based on the most recent Mortgage that was taken out on this home.
Original Mortgage
$158,200
Interest Rate
7.09%
Purchase Details
Closed on
Jun 5, 2001
Sold by
Niederhauser Clare B and Staples Dee R
Bought by
Stevenson Bob
Create a Home Valuation Report for This Property
The Home Valuation Report is an in-depth analysis detailing your home's value as well as a comparison with similar homes in the area
Home Values in the Area
Average Home Value in this Area
Purchase History
| Date | Buyer | Sale Price | Title Company |
|---|---|---|---|
| Griffin Aaron L | -- | First American Title | |
| Griffin Aaron L | -- | Bonneville Title Company Inc | |
| Stevenson Bob | -- | Bonneville Title Company Inc |
Source: Public Records
Mortgage History
| Date | Status | Borrower | Loan Amount |
|---|---|---|---|
| Open | Griffin Aaron L | $164,000 | |
| Closed | Griffin Aaron L | $158,200 |
Source: Public Records
Tax History Compared to Growth
Tax History
| Year | Tax Paid | Tax Assessment Tax Assessment Total Assessment is a certain percentage of the fair market value that is determined by local assessors to be the total taxable value of land and additions on the property. | Land | Improvement |
|---|---|---|---|---|
| 2025 | $3,244 | $312,950 | $123,707 | $189,243 |
| 2024 | $3,211 | $311,850 | $101,129 | $210,721 |
| 2023 | $3,040 | $538,000 | $140,978 | $397,022 |
| 2022 | $3,174 | $308,000 | $81,315 | $226,685 |
| 2021 | $2,776 | $417,000 | $120,031 | $296,969 |
| 2020 | $2,496 | $363,000 | $105,154 | $257,846 |
| 2019 | $2,389 | $343,000 | $102,057 | $240,943 |
| 2018 | $2,225 | $317,000 | $98,955 | $218,045 |
| 2016 | $1,964 | $146,795 | $38,008 | $108,787 |
| 2015 | $2,061 | $146,685 | $38,008 | $108,677 |
| 2014 | $1,913 | $138,711 | $38,008 | $100,703 |
| 2013 | -- | $134,604 | $32,571 | $102,033 |
Source: Public Records
Map
Nearby Homes
- 3169 S 550 W
- 567 W 3575 S
- 454 N 3550 W
- 967 W Yamada Ct
- 101 S 3600 W
- 803 W 2800 S
- 3263 W 850 N
- 1139 W 3150 S
- 697 N 3275 W
- 3583 W 200 S
- 3528 S Finch St
- 3535 W Overlook Dr
- 245 S Summer Breeze Ln
- 3067 S Old Emigrant Rd Unit B
- 2784 S 1720 W Unit F
- 3637 S Creek Side Ln
- 2958 S 1320 W
- 2766 S 1200 W
- 3391 W 1125 N
- 475 W 2400 S