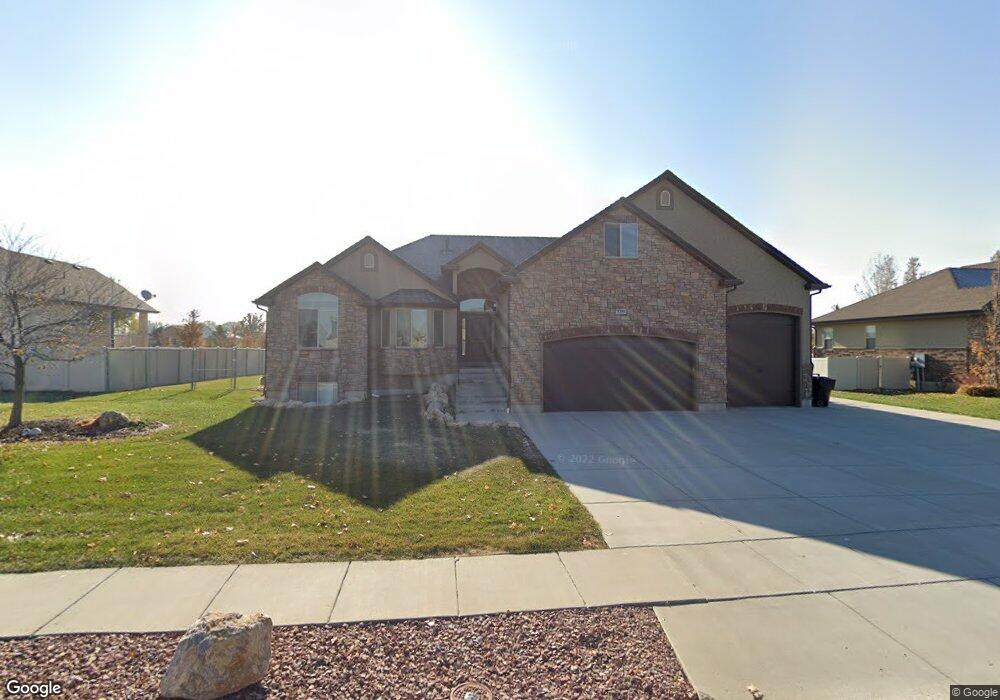
3349 W 1680 N Unit 7CWR Clearfield, UT 84015
Estimated Value: $748,692 - $846,000
4
Beds
3
Baths
2,690
Sq Ft
$292/Sq Ft
Est. Value
About This Home
This home is located at 3349 W 1680 N Unit 7CWR, Clearfield, UT 84015 and is currently estimated at $785,673, approximately $292 per square foot. 3349 W 1680 N Unit 7CWR is a home located in Davis County with nearby schools including West Point School, West Point Junior High School, and Syracuse High School.
Ownership History
Date
Name
Owned For
Owner Type
Purchase Details
Closed on
Apr 1, 2009
Sold by
Vansweden James O
Bought by
Metzler Charlie P and Metzler Dianne S
Current Estimated Value
Home Financials for this Owner
Home Financials are based on the most recent Mortgage that was taken out on this home.
Original Mortgage
$274,491
Outstanding Balance
$181,930
Interest Rate
5.25%
Mortgage Type
Construction
Estimated Equity
$603,743
Purchase Details
Closed on
May 3, 2007
Sold by
Wind River Homes Inc
Bought by
Vansweden James O
Home Financials for this Owner
Home Financials are based on the most recent Mortgage that was taken out on this home.
Original Mortgage
$75,000
Interest Rate
6.15%
Mortgage Type
Purchase Money Mortgage
Purchase Details
Closed on
Oct 12, 2006
Sold by
Cwr Investments Llc
Bought by
Wind River Homes Inc
Create a Home Valuation Report for This Property
The Home Valuation Report is an in-depth analysis detailing your home's value as well as a comparison with similar homes in the area
Home Values in the Area
Average Home Value in this Area
Purchase History
| Date | Buyer | Sale Price | Title Company |
|---|---|---|---|
| Metzler Charlie P | -- | Mountain View Title | |
| Vansweden James O | -- | Bonneville Superior Title Co | |
| Wind River Homes Inc | -- | Bonneville Superior Title Co |
Source: Public Records
Mortgage History
| Date | Status | Borrower | Loan Amount |
|---|---|---|---|
| Open | Metzler Charlie P | $274,491 | |
| Previous Owner | Vansweden James O | $75,000 |
Source: Public Records
Tax History Compared to Growth
Tax History
| Year | Tax Paid | Tax Assessment Tax Assessment Total Assessment is a certain percentage of the fair market value that is determined by local assessors to be the total taxable value of land and additions on the property. | Land | Improvement |
|---|---|---|---|---|
| 2025 | $4,050 | $389,400 | $127,488 | $261,912 |
| 2024 | $3,824 | $369,600 | $135,689 | $233,911 |
| 2023 | $3,539 | $633,000 | $162,243 | $470,757 |
| 2022 | $3,708 | $366,850 | $89,860 | $276,990 |
| 2021 | $3,584 | $526,000 | $128,648 | $397,352 |
| 2020 | $3,160 | $459,000 | $118,849 | $340,151 |
| 2019 | $3,023 | $429,000 | $121,628 | $307,372 |
| 2018 | $2,934 | $409,000 | $100,649 | $308,351 |
| 2016 | $2,779 | $200,035 | $41,021 | $159,014 |
| 2015 | $2,857 | $195,580 | $41,021 | $154,559 |
| 2014 | $2,548 | $177,164 | $41,021 | $136,143 |
| 2013 | -- | $190,034 | $36,812 | $153,222 |
Source: Public Records
Map
Nearby Homes
- 2413 N Eurasian Crane Rd
- 3941 W 1800 N
- 3168 W 1300 N
- 2118 Snowy Crane Dr
- 2959 W 1300 N
- 2921 W 1300 N
- 3892 W 1450 N
- 1172 N 3000 W
- 339 N 3250 W Unit 12
- Torino Farmhouse Plan at Cranefield Estates
- 1700 Farmhouse Plan at Cranefield Estates - Estates Collection
- 2000 Traditional Plan at Cranefield Estates - Estates Collection
- Murano Traditional Plan at Cranefield Estates - Estates Collection
- 2400 Farmhouse Plan at Cranefield Estates - Estates Collection
- 1825 Traditional Plan at Cranefield Estates - Estates Collection
- 1550 Craftsman Plan at Cranefield Estates - Estates Collection
- 2050 Craftsman Plan at Cranefield Estates - Estates Collection
- Murano Traditional Plan at Cranefield Estates
- 2000 Farmhouse Plan at Cranefield Estates - Estates Collection
- 2500 Traditional Plan at Cranefield Estates - Estates Collection
- 3349 W 1680 N
- 3349 W 1680 N Unit 7
- 3323 W 1680 N
- 3323 W 1680 N Unit 6
- 3361 W 1680 N
- 3348 W 1600 N
- 3362 W 1600 N
- 3297 W 1680 N Unit 31
- 3324 W 1600 N
- 3366 W 1680 N
- 1662 N 3420 W
- 1662 N 3420 W Unit 32
- 3344 W 1680 N
- 1648 N 3420 W
- 1648 N 3420 W Unit 31
- 3328 W 1680 N
- 3298 W 1600 N
- 3298 W 1600 N Unit 62
- 3271 W 1680 N Unit 32
- 3271 W 1680 N