Estimated Value: $522,896 - $585,000
3
Beds
3
Baths
2,143
Sq Ft
$257/Sq Ft
Est. Value
About This Home
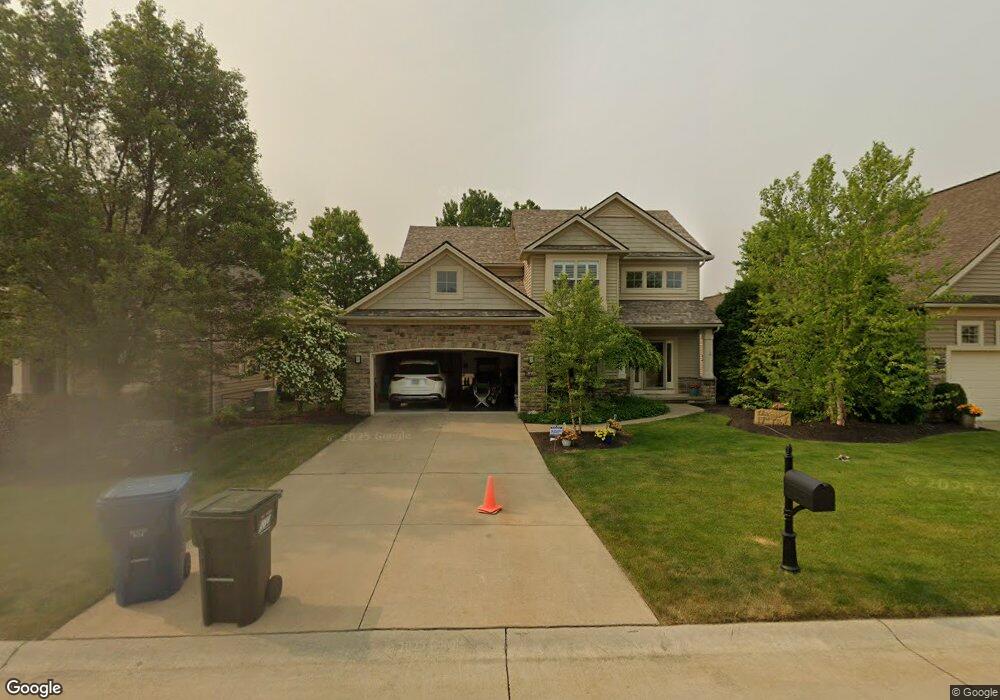
This home is located at 33491 Lyons Gate Run, Avon, OH 44011 and is currently estimated at $549,974, approximately $256 per square foot. 33491 Lyons Gate Run is a home located in Lorain County with nearby schools including Avon East Elementary School, Avon Heritage South Elementary School, and Avon Middle School.
Ownership History
Date
Name
Owned For
Owner Type
Purchase Details
Closed on
Nov 16, 2004
Sold by
Petros Homes Inc
Bought by
Pack John A and Pack Joann M
Current Estimated Value
Home Financials for this Owner
Home Financials are based on the most recent Mortgage that was taken out on this home.
Original Mortgage
$87,103
Outstanding Balance
$64,714
Interest Rate
5.82%
Mortgage Type
Credit Line Revolving
Estimated Equity
$485,260
Purchase Details
Closed on
Jun 15, 2004
Sold by
Carnegie Residential Development Corp
Bought by
Petros Homes Llc
Home Financials for this Owner
Home Financials are based on the most recent Mortgage that was taken out on this home.
Original Mortgage
$920,000
Interest Rate
6.17%
Mortgage Type
Purchase Money Mortgage
Create a Home Valuation Report for This Property
The Home Valuation Report is an in-depth analysis detailing your home's value as well as a comparison with similar homes in the area
Home Values in the Area
Average Home Value in this Area
Purchase History
| Date | Buyer | Sale Price | Title Company |
|---|---|---|---|
| Pack John A | $323,300 | Real Estate Title | |
| Petros Homes Inc | -- | Real Estate Title | |
| Petros Homes Llc | $1,150,000 | Real Estate Title |
Source: Public Records
Mortgage History
| Date | Status | Borrower | Loan Amount |
|---|---|---|---|
| Open | Petros Homes Inc | $87,103 | |
| Open | Pack John A | $220,000 | |
| Previous Owner | Petros Homes Llc | $920,000 | |
| Closed | Petros Homes Llc | $2,000,000 |
Source: Public Records
Tax History
| Year | Tax Paid | Tax Assessment Tax Assessment Total Assessment is a certain percentage of the fair market value that is determined by local assessors to be the total taxable value of land and additions on the property. | Land | Improvement |
|---|---|---|---|---|
| 2024 | $7,739 | $157,416 | $63,000 | $94,416 |
| 2023 | $7,184 | $129,861 | $56,795 | $73,066 |
| 2022 | $7,116 | $129,861 | $56,795 | $73,066 |
| 2021 | $7,131 | $129,861 | $56,795 | $73,066 |
| 2020 | $7,312 | $124,980 | $54,660 | $70,320 |
| 2019 | $7,162 | $124,980 | $54,660 | $70,320 |
| 2018 | $6,362 | $124,980 | $54,660 | $70,320 |
| 2017 | $6,088 | $106,810 | $36,860 | $69,950 |
| 2016 | $6,159 | $106,810 | $36,860 | $69,950 |
| 2015 | $6,220 | $106,810 | $36,860 | $69,950 |
| 2014 | $5,681 | $98,380 | $33,950 | $64,430 |
| 2013 | $5,712 | $98,380 | $33,950 | $64,430 |
Source: Public Records
Map
Nearby Homes
- 33452 Saint Marie Ct
- 4233 Queens Gate
- 33461 Reserve Way at St Andrews
- 33521 Samuel James Ln
- S/L 637 St Gregory Way
- S/L 634 St Gregory Way
- 33571 Augusta Way
- 4142 St Gregory Way
- 4381 Royal st George Dr
- 33011 Heartwood Ave
- 4307 S Fall Lake Dr
- 33958 Crown Colony Dr
- 34465 Heatherwood Ave
- 34348 Crown Colony Dr
- 5104 Main Ave
- 3647 Williams Ct
- 4261 Lake Harbour Way
- 5047 Shady Moss Ln
- 4397 Prestwick Crossing
- 4386 Muirfield Way
- 33493 Lyons Gate Run
- 33489 Lyons Gate Run
- 33495 Lyons Gate Run Unit 431
- 33495 Lyons Gate Run
- 33487 Lyons Gate Run
- 33485 Lyons Gate Run
- 4244 Saint Annes Ct
- 4241 Saint Annes Ct
- 33486 Lyons Gate Run
- 33499 Lyons Gate Run
- 33483 Lyons Gate Run
- 33484 Lyons Gate Run
- 4239 Saint Annes Ct
- 33482 Lyons Gate Run
- 33501 Lyons Gate Run
- 4240 Saint Annes Ct
- 33481 Lyons Gate Run Unit 517
- 4237 Saint Annes Ct
- 4237 Saint Anne's Ct
- 33480 Lyons Gate Run
Your Personal Tour Guide
Ask me questions while you tour the home.