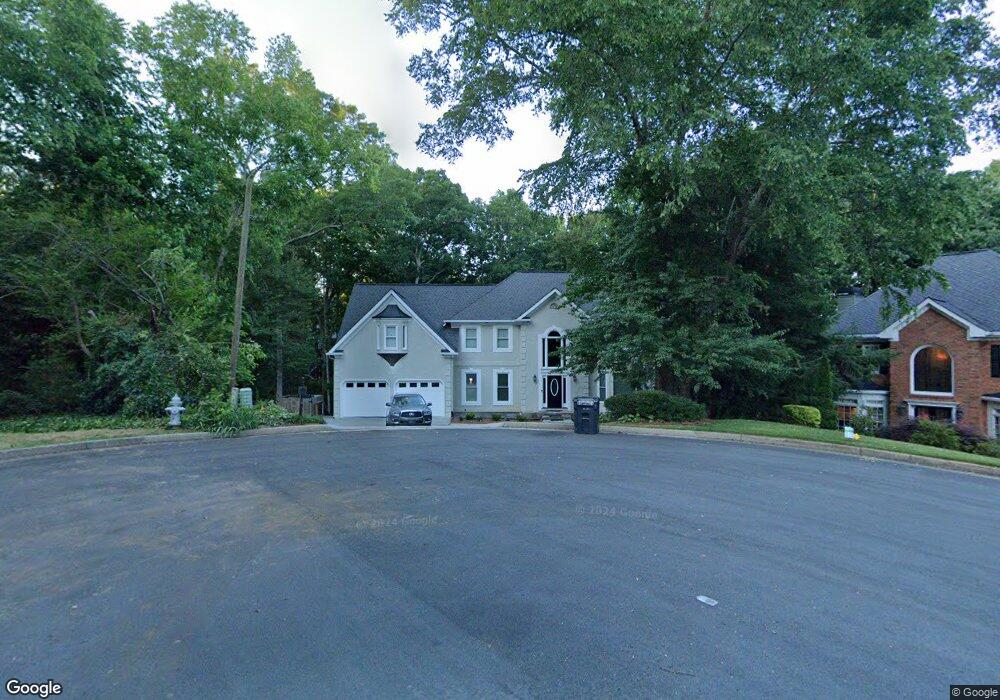
335 Birch Hollow Ct Unit 16 Roswell, GA 30075
Estimated Value: $863,000 - $927,000
6
Beds
5
Baths
4,329
Sq Ft
$205/Sq Ft
Est. Value
About This Home
This home is located at 335 Birch Hollow Ct Unit 16, Roswell, GA 30075 and is currently estimated at $888,639, approximately $205 per square foot. 335 Birch Hollow Ct Unit 16 is a home located in Fulton County with nearby schools including Mountain Park Elementary School, Crabapple Middle School, and Roswell High School.
Ownership History
Date
Name
Owned For
Owner Type
Purchase Details
Closed on
Mar 11, 2024
Sold by
Ruiz Pedro Hernandez
Bought by
Lovell Akilah L and Nunez Nelson R
Current Estimated Value
Home Financials for this Owner
Home Financials are based on the most recent Mortgage that was taken out on this home.
Original Mortgage
$765,000
Outstanding Balance
$752,300
Interest Rate
6.64%
Mortgage Type
New Conventional
Estimated Equity
$136,339
Purchase Details
Closed on
Dec 11, 2019
Sold by
Stanton Judith E
Bought by
Ruiz Pedro Hernandez and Morales Lorena Saldivar
Home Financials for this Owner
Home Financials are based on the most recent Mortgage that was taken out on this home.
Original Mortgage
$380,000
Interest Rate
3.7%
Mortgage Type
New Conventional
Purchase Details
Closed on
May 26, 1995
Sold by
Valley National Fin Servs Co
Bought by
Stanton Judith E
Purchase Details
Closed on
Dec 6, 1994
Sold by
Floring Alan J Debra L
Bought by
Valley National Financial Serv Co
Create a Home Valuation Report for This Property
The Home Valuation Report is an in-depth analysis detailing your home's value as well as a comparison with similar homes in the area
Home Values in the Area
Average Home Value in this Area
Purchase History
| Date | Buyer | Sale Price | Title Company |
|---|---|---|---|
| Lovell Akilah L | $850,000 | -- | |
| Ruiz Pedro Hernandez | $480,000 | -- | |
| Stanton Judith E | $255,000 | -- | |
| Valley National Financial Serv Co | $55,600 | -- |
Source: Public Records
Mortgage History
| Date | Status | Borrower | Loan Amount |
|---|---|---|---|
| Open | Lovell Akilah L | $765,000 | |
| Previous Owner | Ruiz Pedro Hernandez | $380,000 |
Source: Public Records
Tax History Compared to Growth
Tax History
| Year | Tax Paid | Tax Assessment Tax Assessment Total Assessment is a certain percentage of the fair market value that is determined by local assessors to be the total taxable value of land and additions on the property. | Land | Improvement |
|---|---|---|---|---|
| 2025 | $1,601 | $360,600 | $93,280 | $267,320 |
| 2023 | $7,544 | $267,280 | $70,200 | $197,080 |
| 2022 | $6,568 | $249,640 | $38,360 | $211,280 |
| 2021 | $6,594 | $207,040 | $42,280 | $164,760 |
| 2020 | $6,287 | $192,000 | $51,400 | $140,600 |
| 2019 | $836 | $210,600 | $71,320 | $139,280 |
| 2018 | $4,817 | $188,120 | $52,120 | $136,000 |
| 2017 | $4,813 | $180,880 | $50,120 | $130,760 |
| 2016 | $4,790 | $180,880 | $50,120 | $130,760 |
| 2015 | $5,683 | $180,880 | $50,120 | $130,760 |
| 2014 | $4,200 | $149,760 | $45,720 | $104,040 |
Source: Public Records
Map
Nearby Homes
- 1820 Azalea Springs Trail
- 715 Winterwind Way
- 230 Moss Stone Way Unit 2
- 11775 Highland Colony Dr Unit 1
- 11790 Highland Colony Dr
- 150 Flowing Spring Trail Unit 4
- 2000 Trotters Ridge Way Unit 2B
- 11675 Highland Colony Dr Unit 1
- 1065 Laurian Park Dr
- 4973 Gunners Pass NE
- 475 Laurian View Ct
- 235 Foxley Way
- 1945 Ledieu Rd
- 4383 Capstone Ct NE
- 4304 Lindsey Way NE
- 1460 Lakemist Ct
- 12180 Lonsdale Ln
- 335 Birch Hollow Ct
- 310 Birch Hollow Ct Unit 2B
- 325 Birch Hollow Ct Unit 2B
- 11810 Wildwood Springs Dr
- 11800 Wildwood Springs Dr
- 600 Red Fern Ct
- 11790 Wildwood Springs Dr Unit 3
- 315 Birch Hollow Ct
- 1815 Azalea Springs Trail
- 610 Red Fern Ct Unit 3
- 1805 Azalea Springs Trail
- 1785 Azalea Springs Trail
- 1795 Azalea Springs Trail
- 1825 Azalea Springs Trail
- 11780 Wildwood Springs Dr Unit 3
- 1755 Azalea Springs Trail
- 0 Red Fern Ct Unit 8169928
- 305 Birch Hollow Ct
- 620 Red Fern Ct
- 11770 Wildwood Springs Dr