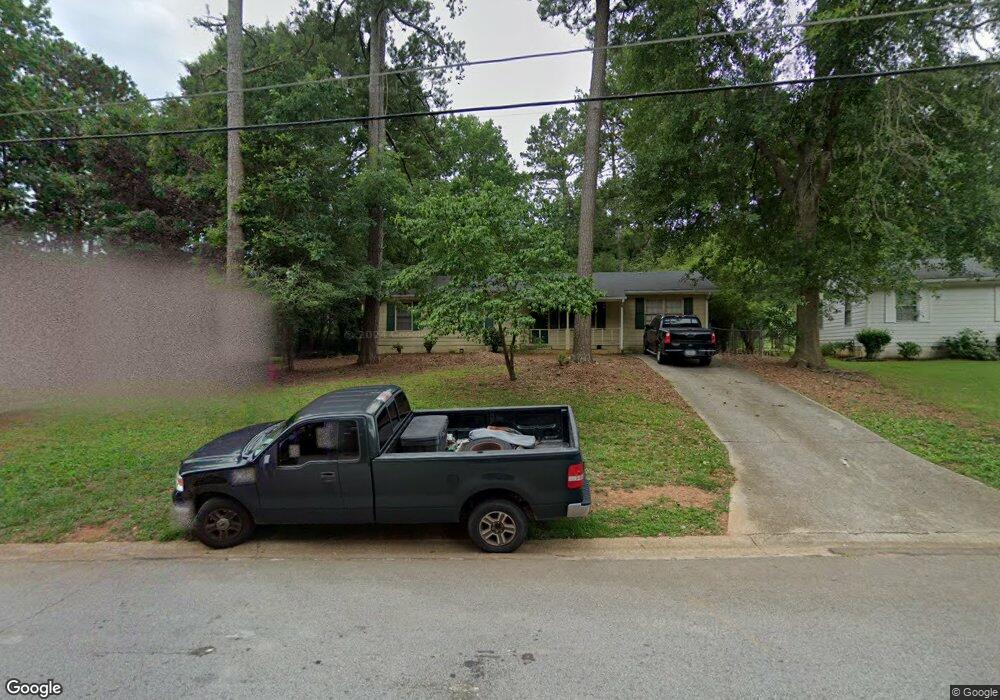
335 Cindy Dr SE Unit 1 Conyers, GA 30094
Estimated Value: $182,000 - $235,000
3
Beds
2
Baths
1,325
Sq Ft
$156/Sq Ft
Est. Value
About This Home
This home is located at 335 Cindy Dr SE Unit 1, Conyers, GA 30094 and is currently estimated at $206,355, approximately $155 per square foot. 335 Cindy Dr SE Unit 1 is a home located in Rockdale County with nearby schools including Sims Elementary School, Edwards Middle School, and Heritage High School.
Ownership History
Date
Name
Owned For
Owner Type
Purchase Details
Closed on
Sep 1, 2013
Sold by
Winders Garland K
Bought by
Winders T and 335 Cindy Drive Trust
Current Estimated Value
Purchase Details
Closed on
Jun 28, 2012
Sold by
Freeman Lm
Bought by
Winders Garland K
Home Financials for this Owner
Home Financials are based on the most recent Mortgage that was taken out on this home.
Original Mortgage
$75,400
Interest Rate
3.76%
Mortgage Type
New Conventional
Purchase Details
Closed on
Apr 15, 2004
Sold by
Winders Garland K
Bought by
Ebenezer Cindy
Purchase Details
Closed on
Oct 20, 2000
Sold by
Parmeter Terry L
Bought by
Metts Ricki R
Home Financials for this Owner
Home Financials are based on the most recent Mortgage that was taken out on this home.
Original Mortgage
$84,509
Interest Rate
7.91%
Mortgage Type
New Conventional
Create a Home Valuation Report for This Property
The Home Valuation Report is an in-depth analysis detailing your home's value as well as a comparison with similar homes in the area
Home Values in the Area
Average Home Value in this Area
Purchase History
| Date | Buyer | Sale Price | Title Company |
|---|---|---|---|
| Winders T | -- | -- | |
| Winders Garland K | -- | -- | |
| Ebenezer Cindy | -- | -- | |
| Metts Ricki R | $87,000 | -- |
Source: Public Records
Mortgage History
| Date | Status | Borrower | Loan Amount |
|---|---|---|---|
| Previous Owner | Winders Garland K | $75,400 | |
| Previous Owner | Metts Ricki R | $84,509 |
Source: Public Records
Tax History Compared to Growth
Tax History
| Year | Tax Paid | Tax Assessment Tax Assessment Total Assessment is a certain percentage of the fair market value that is determined by local assessors to be the total taxable value of land and additions on the property. | Land | Improvement |
|---|---|---|---|---|
| 2024 | $2,678 | $66,280 | $17,720 | $48,560 |
| 2023 | $2,384 | $57,200 | $11,600 | $45,600 |
| 2022 | $2,146 | $51,200 | $12,880 | $38,320 |
| 2021 | $1,626 | $38,680 | $8,160 | $30,520 |
| 2020 | $1,234 | $28,960 | $6,400 | $22,560 |
| 2019 | $1,147 | $25,560 | $5,200 | $20,360 |
| 2018 | $1,061 | $23,520 | $5,200 | $18,320 |
| 2017 | $830 | $18,240 | $4,240 | $14,000 |
| 2016 | $830 | $18,240 | $4,240 | $14,000 |
| 2015 | $749 | $16,440 | $4,240 | $12,200 |
| 2014 | $485 | $10,542 | $3,200 | $7,342 |
| 2013 | -- | $28,080 | $6,600 | $21,480 |
Source: Public Records
Map
Nearby Homes
- 309 Windsor Walk SE Unit 1
- 340 Windsor Walk SE
- 2631 Rolling Hills Way SE
- 1601 Creek Crossing SE
- 2370 Ebenezer Rd SE
- 250 Smile Dr SE
- 170 Old Mill Trail SW
- 1420 Hillside Place SE
- 1508 Hillside Dr SE
- 2617 Laurel Woods Ln SE Unit 3
- 1511 Hillside Dr SE
- 1624 Sugarmaple Ln SW
- 1598 Cherry Hill Ln SW Unit 5
- 325 Yukon Dr Unit 66
- 335 Yukon Dr Unit 61
- 341 Yukon Dr Unit 58
- 4980 SE West Lake Dr
- 4811 SE West Lake Dr
- 343 Cindy Dr SE Unit 1
- 329 Cindy Dr SE
- 308 Windsor Walk SE
- 312 Windsor Walk SE Unit I
- 351 Cindy Dr SE
- 304 Windsor Walk SE Unit 1/15
- 304 Windsor Walk SE Unit 1
- 0 Cindy Dr SE Unit 7431026
- 0 Cindy Dr SE Unit 7087073
- 0 Cindy Dr SE Unit 3178665
- 0 Cindy Dr SE Unit 8861749
- 0 Cindy Dr SE Unit 8644059
- 316 Windsor Walk SE
- 323 Cindy Dr SE
- 344 Cindy Dr SE Unit 1
- 334 Cindy Dr SE
- 326 Cindy Dr SE
- 320 Windsor Walk SE
- 359 Cindy Dr SE
- 319 Cindy Dr SE