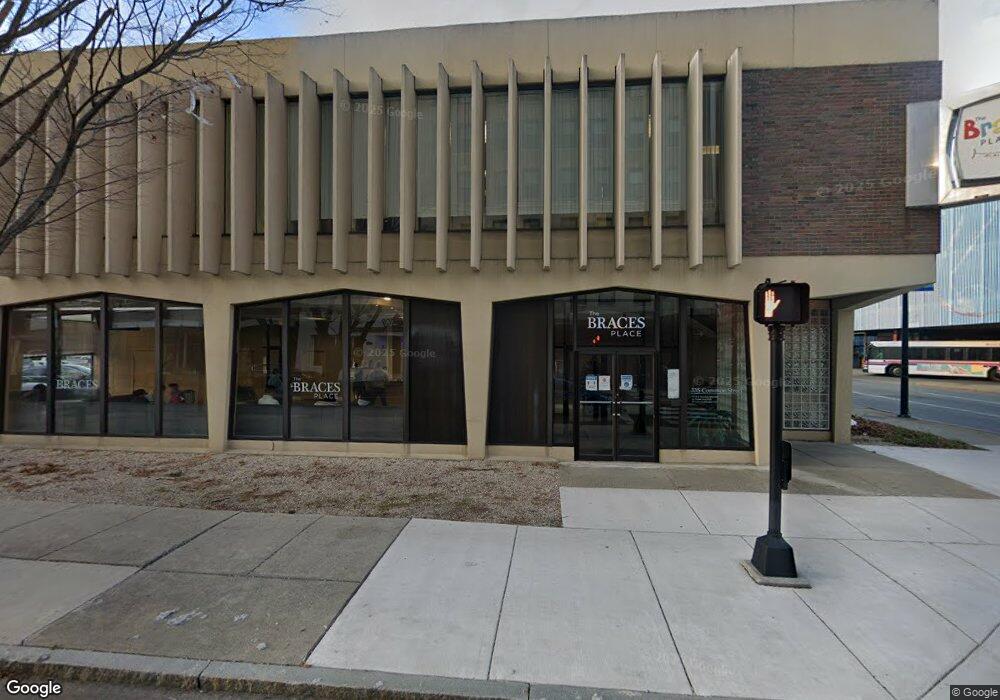
335 Common St Lawrence, MA 01840
Downtown Lawrence NeighborhoodEstimated Value: $2,697,843
Studio
7
Baths
7,738
Sq Ft
$349/Sq Ft
Est. Value
About This Home
This home is located at 335 Common St, Lawrence, MA 01840 and is currently estimated at $2,697,843, approximately $348 per square foot. 335 Common St is a home located in Essex County with nearby schools including School For Exceptional Studies, Lawrence Family Development Charter School, and Blessed Stephen Bellesini O.S.A. Academy.
Ownership History
Date
Name
Owned For
Owner Type
Purchase Details
Closed on
Jan 13, 2012
Sold by
Discovery Bay Rt and Richter
Bought by
Lacourt Realty Llc
Current Estimated Value
Home Financials for this Owner
Home Financials are based on the most recent Mortgage that was taken out on this home.
Original Mortgage
$862,500
Outstanding Balance
$587,573
Interest Rate
4%
Mortgage Type
Commercial
Estimated Equity
$2,110,270
Purchase Details
Closed on
Oct 25, 2011
Sold by
3 Kingdoms Holdings Ll and Bayview Loan Svcng Llc
Bought by
Discovery Bay Rt and Richter
Purchase Details
Closed on
Jun 30, 2004
Sold by
Frank Rt and Biancardi
Bought by
Three Kingdoms Hldng L
Purchase Details
Closed on
Jun 25, 2001
Sold by
Akiva Rt and Lebowitz Craig L
Bought by
Frank Rt and Biancardi Ii Frank A
Purchase Details
Closed on
Mar 2, 2000
Sold by
D&D Rt and Dagata Salvatore
Bought by
Akiva Rt and Lebowitz Craig L
Purchase Details
Closed on
Jul 20, 1988
Sold by
Sect 1031 Trust
Bought by
Lebowitz Walter B
Create a Home Valuation Report for This Property
The Home Valuation Report is an in-depth analysis detailing your home's value as well as a comparison with similar homes in the area
Home Values in the Area
Average Home Value in this Area
Purchase History
| Date | Buyer | Sale Price | Title Company |
|---|---|---|---|
| Lacourt Realty Llc | $1,150,000 | -- | |
| Discovery Bay Rt | $245,000 | -- | |
| Discovery Bay Rt | $245,000 | -- | |
| Three Kingdoms Hldng L | $575,000 | -- | |
| Three Kingdoms Hldng L | $575,000 | -- | |
| Frank Rt | $50,000 | -- | |
| Frank Rt | $50,000 | -- | |
| Akiva Rt | $220,000 | -- | |
| Akiva Rt | $220,000 | -- | |
| Lebowitz Walter B | $550,000 | -- |
Source: Public Records
Mortgage History
| Date | Status | Borrower | Loan Amount |
|---|---|---|---|
| Open | Lebowitz Walter B | $862,500 | |
| Closed | Lebowitz Walter B | $862,500 |
Source: Public Records
Tax History
| Year | Tax Paid | Tax Assessment Tax Assessment Total Assessment is a certain percentage of the fair market value that is determined by local assessors to be the total taxable value of land and additions on the property. | Land | Improvement |
|---|---|---|---|---|
| 2025 | $21,240 | $1,153,700 | $257,500 | $896,200 |
| 2024 | $19,639 | $1,013,900 | $220,400 | $793,500 |
| 2023 | $19,018 | $899,600 | $184,000 | $715,600 |
| 2022 | $19,128 | $790,100 | $166,700 | $623,400 |
| 2021 | $19,434 | $736,400 | $147,900 | $588,500 |
| 2020 | $19,655 | $733,400 | $144,900 | $588,500 |
| 2019 | $18,762 | $645,400 | $141,300 | $504,100 |
| 2018 | $18,840 | $611,300 | $121,500 | $489,800 |
| 2017 | $16,735 | $498,200 | $107,300 | $390,900 |
| 2016 | $16,642 | $493,100 | $102,200 | $390,900 |
| 2015 | $18,443 | $568,700 | $102,200 | $466,500 |
Source: Public Records
Map
Nearby Homes
- 46 Amesbury St Unit 2B
- 71-75 Common St
- 11 Lawrence St Unit 606
- 202 Broadway Unit 3-2
- 202 Broadway Unit 3-3
- 131A Lawrence St Unit 40
- 91 Summer St Unit 2
- 89 Newbury St Unit 89B
- 7-9 Bennington St
- 324-326 Broadway
- 42 Morton St
- 80-82 Haverhill St
- 82 Water St
- 10 Holly St
- 192 Union St
- 27 Willow St Unit A
- 29-31 Washington St
- 5 Kendrick St
- 499 Haverhill St
- 82 S Broadway
- 335 Common St Unit 2
- 335 Common St Unit 1
- 335 Common St
- 336 Common St
- 143-A&B Bennington St
- 468-470 Hamphire St
- 42 Amesbury St
- 375 Common St Unit E
- 46 Amesbury St Unit 8D
- 46 Amesbury St Unit 8C
- 46 Amesbury St Unit 8B
- 46 Amesbury St Unit 8A
- 46 Amesbury St Unit 7D
- 46 Amesbury St Unit 7C
- 46 Amesbury St Unit 7B
- 46 Amesbury St Unit 7A
- 46 Amesbury St Unit 6D
- 46 Amesbury St Unit 6C
- 46 Amesbury St Unit 6B
- 46 Amesbury St Unit 6A
Your Personal Tour Guide
Ask me questions while you tour the home.