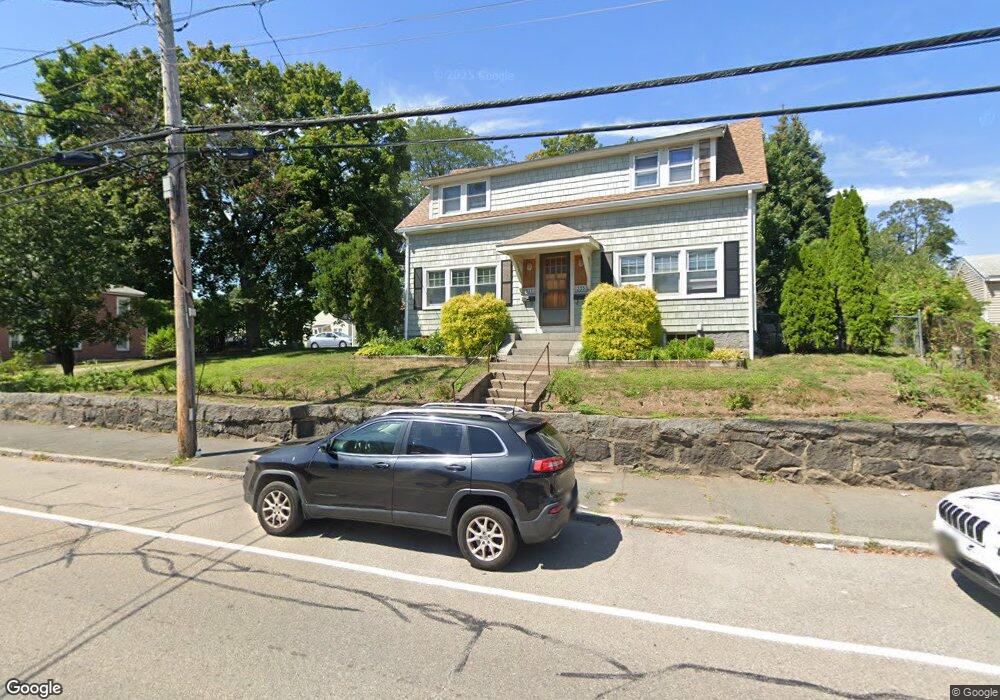
335 Copeland St Quincy, MA 02169
South Quincy NeighborhoodEstimated Value: $788,000 - $846,000
4
Beds
2
Baths
2,039
Sq Ft
$403/Sq Ft
Est. Value
About This Home
This home is located at 335 Copeland St, Quincy, MA 02169 and is currently estimated at $821,204, approximately $402 per square foot. 335 Copeland St is a home located in Norfolk County with nearby schools including South West Middle School, Lincoln-Hancock Community School, and Quincy High School.
Ownership History
Date
Name
Owned For
Owner Type
Purchase Details
Closed on
Sep 12, 2014
Sold by
Clarke Charles R and Clarke Suk H
Bought by
Clarke 3Rd Charles R and Clarke Lisa L
Current Estimated Value
Home Financials for this Owner
Home Financials are based on the most recent Mortgage that was taken out on this home.
Original Mortgage
$208,000
Outstanding Balance
$159,120
Interest Rate
4.12%
Mortgage Type
New Conventional
Estimated Equity
$662,084
Purchase Details
Closed on
Feb 26, 1988
Sold by
Jessup John E
Bought by
Clarke Suk H
Home Financials for this Owner
Home Financials are based on the most recent Mortgage that was taken out on this home.
Original Mortgage
$145,000
Interest Rate
10.49%
Mortgage Type
Purchase Money Mortgage
Create a Home Valuation Report for This Property
The Home Valuation Report is an in-depth analysis detailing your home's value as well as a comparison with similar homes in the area
Home Values in the Area
Average Home Value in this Area
Purchase History
| Date | Buyer | Sale Price | Title Company |
|---|---|---|---|
| Clarke 3Rd Charles R | $260,000 | -- | |
| Clarke Suk H | $145,000 | -- |
Source: Public Records
Mortgage History
| Date | Status | Borrower | Loan Amount |
|---|---|---|---|
| Open | Clarke 3Rd Charles R | $208,000 | |
| Previous Owner | Clarke Suk H | $100,000 | |
| Previous Owner | Clarke Suk H | $145,000 |
Source: Public Records
Tax History Compared to Growth
Tax History
| Year | Tax Paid | Tax Assessment Tax Assessment Total Assessment is a certain percentage of the fair market value that is determined by local assessors to be the total taxable value of land and additions on the property. | Land | Improvement |
|---|---|---|---|---|
| 2025 | $8,533 | $740,100 | $317,600 | $422,500 |
| 2024 | $8,005 | $710,300 | $302,800 | $407,500 |
| 2023 | $7,611 | $683,800 | $288,700 | $395,100 |
| 2022 | $7,242 | $604,500 | $232,000 | $372,500 |
| 2021 | $6,741 | $555,300 | $232,000 | $323,300 |
| 2020 | $6,902 | $555,300 | $232,000 | $323,300 |
| 2019 | $6,560 | $522,700 | $225,500 | $297,200 |
| 2018 | $6,613 | $495,700 | $209,200 | $286,500 |
| 2017 | $6,214 | $438,500 | $199,500 | $239,000 |
| 2016 | $5,698 | $396,800 | $181,900 | $214,900 |
| 2015 | $5,624 | $385,200 | $171,900 | $213,300 |
| 2014 | $5,082 | $342,000 | $171,900 | $170,100 |
Source: Public Records
Map
Nearby Homes
- 328 Copeland St Unit 3E
- 2 Ricciuti Dr Unit 8
- 230 Willard St Unit 204
- 41 Filbert St
- 211 Copeland St
- 28 Miller St Unit 8
- 145 Suomi Rd Unit C7
- 57A West St
- 73 Connell St
- 29 Oconnell Ave
- 47 Connell St
- 9 Common St Unit 3
- 57 Buckley St
- 52 Bunker Hill Ln
- 55 Station St Unit 1
- 72 Centre St Unit J
- 46 Suomi Rd
- 46 Suomi Rd Unit 46
- 211 West St Unit 12B
- 1 Cityview Ln Unit 210
- 329 Copeland St
- 116 Crescent St
- 116 Crescent St
- 122 Crescent St
- 351 Copeland St
- 327 Copeland St
- 108 Crescent St
- 349 Copeland St
- 128 Crescent St
- 128 Crescent St Unit 3
- 104 Crescent St
- 321 Copeland St
- 355 Copeland St
- 102 Crescent St
- 136 Crescent St
- 352 Copeland St
- 328 Copeland St Unit 1B
- 328 Copeland St Unit 2A
- 328 Copeland St Unit 1D
- 328 Copeland St Unit 1A