
Landlord's Agent in 2020
Colleen Vigeant
Elyse Harney Real Estate
(860) 480-8033
8 in this area
26 Total Sales
Estimated Value: $490,000 - $831,000
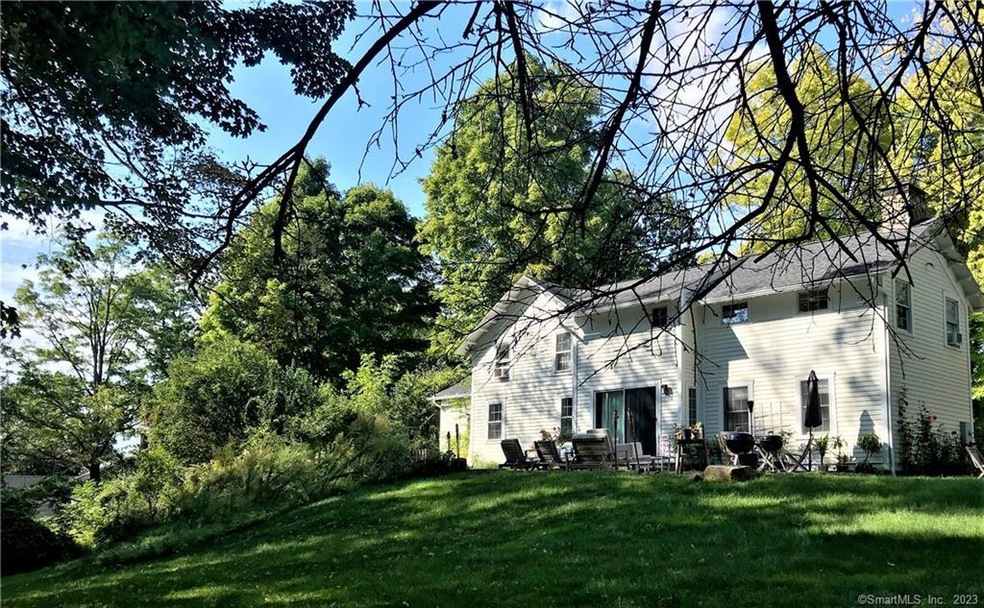
Hillside Hideaway- Available: Memorial Day through Labor Day - Come enjoy the summer season in the Litchfield Hills. Bordering the Sharon Audubon Center, this recently updated 3 Bedroom, 2.5 Bath, Farmhouse, is the perfect summer retreat. A spacious open well equipped Kitchen offering all modern conveniences flows through to the Dining- Room and Screened-in porch. Living-room with stone fireplace opens out to the sunny furnished patio overlooking picturesque country fields and barns. Only two hours from NYC, and 15 minutes to Metro-North. Close to Sharon Audubon Center, Sharon Playhouse, Appalachian Trail hiking, and the quintessential villages of Millerton and Lakeville/Salisbury.
Last Agent to Rent the Property
Elyse Harney Real Estate License #RES.0810529 Listed on: 03/02/2020
Last Renter's Agent
Elyse Harney Real Estate License #RES.0810529 Listed on: 03/02/2020
| Date | Buyer | Sale Price | Title Company |
|---|---|---|---|
| Hafford Jessica L | $17,000 | -- |
| Date | Status | Borrower | Loan Amount |
|---|---|---|---|
| Open | Hafford Jessica L | $320,000 | |
| Closed | Hafford Jessica L | $228,000 | |
| Closed | Hafford Jessica L | $38,000 | |
| Closed | Hafford Jessica L | $38,000 |
| Date | Event | Price | List to Sale | Price per Sq Ft | Prior Sale |
|---|---|---|---|---|---|
| 04/22/2020 04/22/20 | Rented | $15,000 | 0.0% | -- | |
| 03/02/2020 03/02/20 | For Rent | $15,000 | 0.0% | -- | |
| 05/29/2015 05/29/15 | Sold | $140,000 | -12.5% | $72 / Sq Ft | View Prior Sale |
| 04/16/2015 04/16/15 | Pending | -- | -- | -- | |
| 01/02/2015 01/02/15 | For Sale | $160,000 | -- | $83 / Sq Ft |
| Year | Tax Paid | Tax Assessment Tax Assessment Total Assessment is a certain percentage of the fair market value that is determined by local assessors to be the total taxable value of land and additions on the property. | Land | Improvement |
|---|---|---|---|---|
| 2025 | $3,677 | $329,800 | $77,600 | $252,200 |
| 2024 | $3,479 | $329,800 | $77,600 | $252,200 |
| 2023 | $2,984 | $207,200 | $57,000 | $150,200 |
| 2022 | $2,984 | $207,200 | $57,000 | $150,200 |
| 2021 | $3,004 | $207,200 | $57,000 | $150,200 |
| 2020 | $2,984 | $207,200 | $57,000 | $150,200 |
| 2019 | $2,984 | $207,200 | $57,000 | $150,200 |
| 2018 | $2,730 | $185,700 | $54,100 | $131,600 |
| 2017 | $2,730 | $185,700 | $54,100 | $131,600 |
| 2016 | $2,526 | $175,400 | $54,100 | $121,300 |
| 2015 | $2,403 | $175,400 | $54,100 | $121,300 |
| 2014 | $2,324 | $175,400 | $54,100 | $121,300 |
Landlord's Agent in 2020
Colleen Vigeant
Elyse Harney Real Estate
(860) 480-8033
8 in this area
26 Total Sales
M
Seller's Agent in 2015
Mary Kirby
William Pitt
Buyer's Agent in 2015
Laurie Dunham
William Pitt
(203) 985-5974
7 in this area
25 Total Sales
Source: SmartMLS
MLS Number: 170277450
APN: SHAR-000009-000023-000001
Disclaimer: Certain information contained herein is derived from information provided by parties other than Homes.com. All information provided is deemed reliable, but is not guaranteed to be accurate and should be independently verified.
![]() IDX information is provided exclusively for personal, non-commercial use, and may not be used for any purpose other than to identify prospective properties consumers may be interested in purchasing. Information is deemed reliable but not guaranteed.
IDX information is provided exclusively for personal, non-commercial use, and may not be used for any purpose other than to identify prospective properties consumers may be interested in purchasing. Information is deemed reliable but not guaranteed.
Ask me questions while you tour the home.