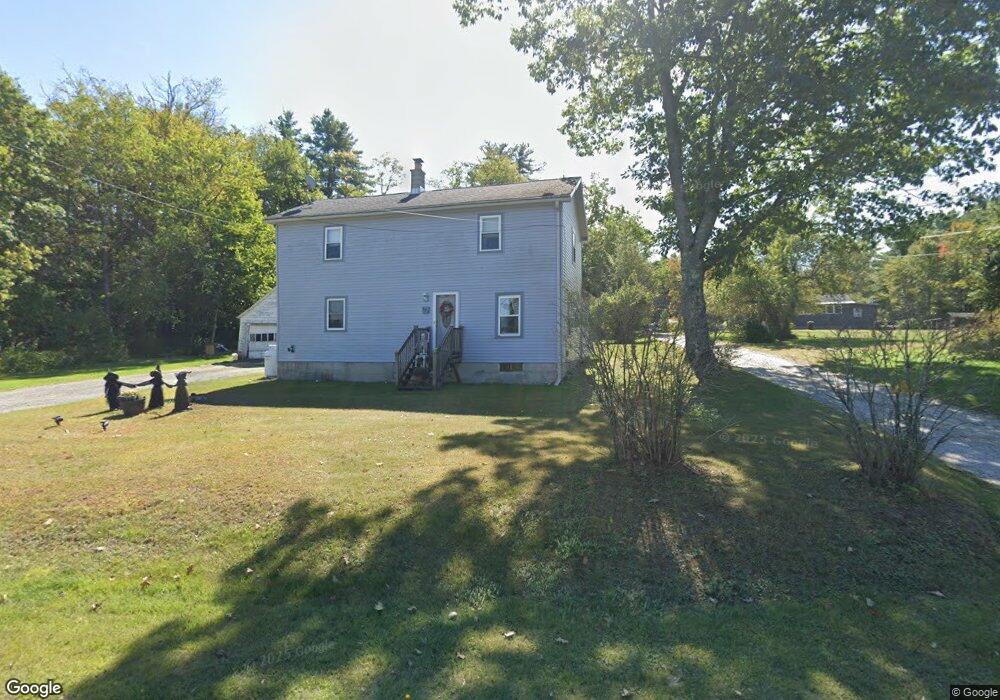
335 Cross Rd Clarksburg, MA 01247
Estimated Value: $207,000 - $258,068
3
Beds
1
Bath
1,100
Sq Ft
$209/Sq Ft
Est. Value
About This Home
This home is located at 335 Cross Rd, Clarksburg, MA 01247 and is currently estimated at $230,267, approximately $209 per square foot. 335 Cross Rd is a home located in Berkshire County with nearby schools including Clarksburg Elementary School.
Ownership History
Date
Name
Owned For
Owner Type
Purchase Details
Closed on
Dec 30, 1999
Sold by
Moser Stephen K and Moser Patricia
Bought by
Demers Glen C and Malinowski Elizabeth
Current Estimated Value
Home Financials for this Owner
Home Financials are based on the most recent Mortgage that was taken out on this home.
Original Mortgage
$70,200
Interest Rate
7.71%
Mortgage Type
Purchase Money Mortgage
Purchase Details
Closed on
May 4, 1994
Sold by
Moser Stephen K and Moser Kathleen M
Bought by
Moser Stephen K and Moser Patricia
Create a Home Valuation Report for This Property
The Home Valuation Report is an in-depth analysis detailing your home's value as well as a comparison with similar homes in the area
Home Values in the Area
Average Home Value in this Area
Purchase History
| Date | Buyer | Sale Price | Title Company |
|---|---|---|---|
| Demers Glen C | $78,000 | -- | |
| Moser Stephen K | $60,000 | -- |
Source: Public Records
Mortgage History
| Date | Status | Borrower | Loan Amount |
|---|---|---|---|
| Open | Moser Stephen K | $125,000 | |
| Closed | Moser Stephen K | $123,000 | |
| Closed | Moser Stephen K | $70,000 | |
| Closed | Moser Stephen K | $70,200 |
Source: Public Records
Tax History Compared to Growth
Tax History
| Year | Tax Paid | Tax Assessment Tax Assessment Total Assessment is a certain percentage of the fair market value that is determined by local assessors to be the total taxable value of land and additions on the property. | Land | Improvement |
|---|---|---|---|---|
| 2025 | $2,463 | $181,400 | $43,100 | $138,300 |
| 2024 | $2,662 | $173,400 | $37,100 | $136,300 |
| 2023 | $2,596 | $167,900 | $37,100 | $130,800 |
| 2022 | $2,587 | $157,000 | $37,100 | $119,900 |
| 2021 | $2,311 | $146,100 | $37,100 | $109,000 |
| 2020 | $2,678 | $149,700 | $46,100 | $103,600 |
| 2019 | $2,485 | $155,500 | $45,800 | $109,700 |
| 2018 | $2,479 | $161,900 | $45,800 | $116,100 |
| 2016 | $2,142 | $139,800 | $45,800 | $94,000 |
| 2015 | $2,111 | $149,800 | $49,300 | $100,500 |
| 2014 | $2,132 | $159,600 | $49,300 | $110,300 |
Source: Public Records
Map
Nearby Homes