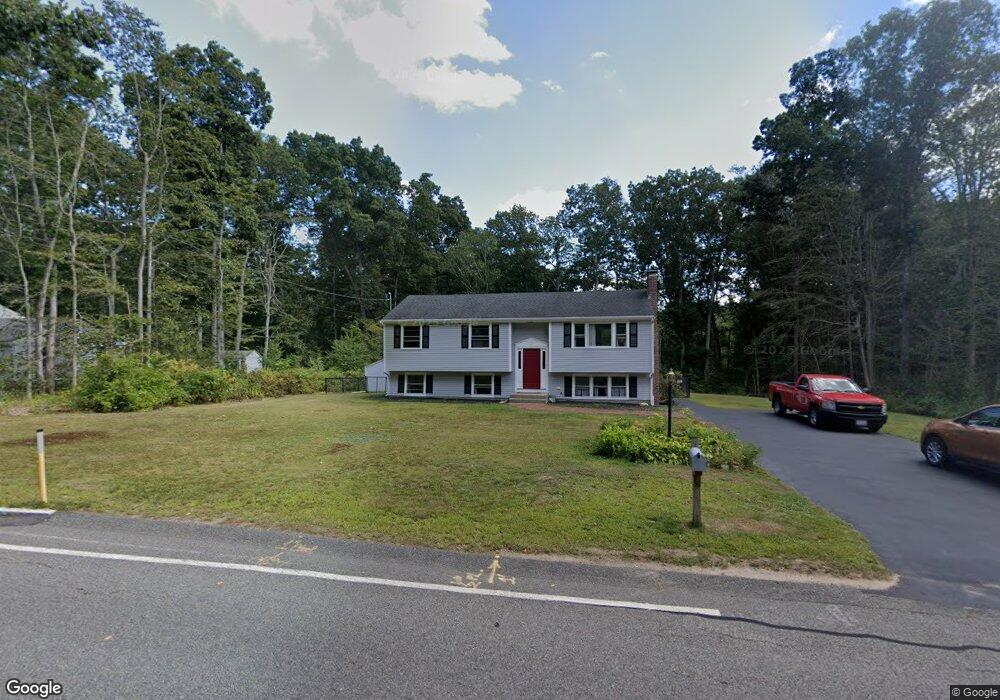
335 Dillingham Way Hanover, MA 02339
Estimated Value: $606,000 - $817,000
3
Beds
2
Baths
1,044
Sq Ft
$662/Sq Ft
Est. Value
About This Home
This home is located at 335 Dillingham Way, Hanover, MA 02339 and is currently estimated at $690,751, approximately $661 per square foot. 335 Dillingham Way is a home located in Plymouth County with nearby schools including Hanover High School, South Shore Charter Public School, and Norwell KinderCare.
Ownership History
Date
Name
Owned For
Owner Type
Purchase Details
Closed on
Jul 1, 1993
Sold by
Ostrum Carol A
Bought by
Quigg John R and Quigg Jacqueline M
Current Estimated Value
Home Financials for this Owner
Home Financials are based on the most recent Mortgage that was taken out on this home.
Original Mortgage
$124,000
Interest Rate
7.46%
Mortgage Type
Purchase Money Mortgage
Create a Home Valuation Report for This Property
The Home Valuation Report is an in-depth analysis detailing your home's value as well as a comparison with similar homes in the area
Home Values in the Area
Average Home Value in this Area
Purchase History
| Date | Buyer | Sale Price | Title Company |
|---|---|---|---|
| Quigg John R | $160,000 | -- |
Source: Public Records
Mortgage History
| Date | Status | Borrower | Loan Amount |
|---|---|---|---|
| Closed | Quigg John R | $124,000 | |
| Previous Owner | Quigg John R | $50,000 |
Source: Public Records
Tax History Compared to Growth
Tax History
| Year | Tax Paid | Tax Assessment Tax Assessment Total Assessment is a certain percentage of the fair market value that is determined by local assessors to be the total taxable value of land and additions on the property. | Land | Improvement |
|---|---|---|---|---|
| 2025 | $7,258 | $587,700 | $269,400 | $318,300 |
| 2024 | $7,255 | $565,000 | $269,400 | $295,600 |
| 2023 | $6,966 | $516,400 | $244,900 | $271,500 |
| 2022 | $7,177 | $470,600 | $244,900 | $225,700 |
| 2021 | $6,908 | $423,000 | $222,600 | $200,400 |
| 2020 | $3,985 | $419,500 | $222,600 | $196,900 |
| 2019 | $3,600 | $391,400 | $222,600 | $168,800 |
| 2018 | $3,395 | $387,800 | $222,600 | $165,200 |
| 2017 | $3,285 | $338,600 | $209,500 | $129,100 |
| 2016 | $5,388 | $319,600 | $190,500 | $129,100 |
| 2015 | $4,761 | $294,800 | $190,500 | $104,300 |
Source: Public Records
Map
Nearby Homes
- 276 Woodland Dr
- 53 Chestnut St
- 375 Webster St
- 70 Dillingham Way
- 7 Assinippi Ave Unit 306
- 1239 Main St
- 118 Bates Way
- 114 Main St
- 80 Coolidge Rd
- 62 Larchmont Ln
- 265 Silver St
- 225 Prospect St
- 214 Washington St Unit 24
- 214 Washington St Unit 28
- 216 Whiting St
- 348 Main St
- 14 Longwood Ln Unit 14
- 8 Old Farm Rd
- 62 High St
- 3 Blueberry Ct
- 321 Dillingham Way
- 40 Spruce Cir
- 334 Dillingham Way
- 348 Dillingham Way
- 267 Woodland Dr
- 309 Dillingham Way
- 281 Woodland Dr
- 320 Dillingham Way
- 233 Woodland Dr
- 34 Spruce Cir
- 13 Spruce Cir
- 308 Dillingham Way
- 246 Woodland Dr
- 223 Woodland Dr
- 26 Spruce Cir
- 226 Woodland Dr
- 184 Old Town Way
- 18 Blue Spruce Ln
- 198 Old Town Way
- 21 Blue Spruce Ln