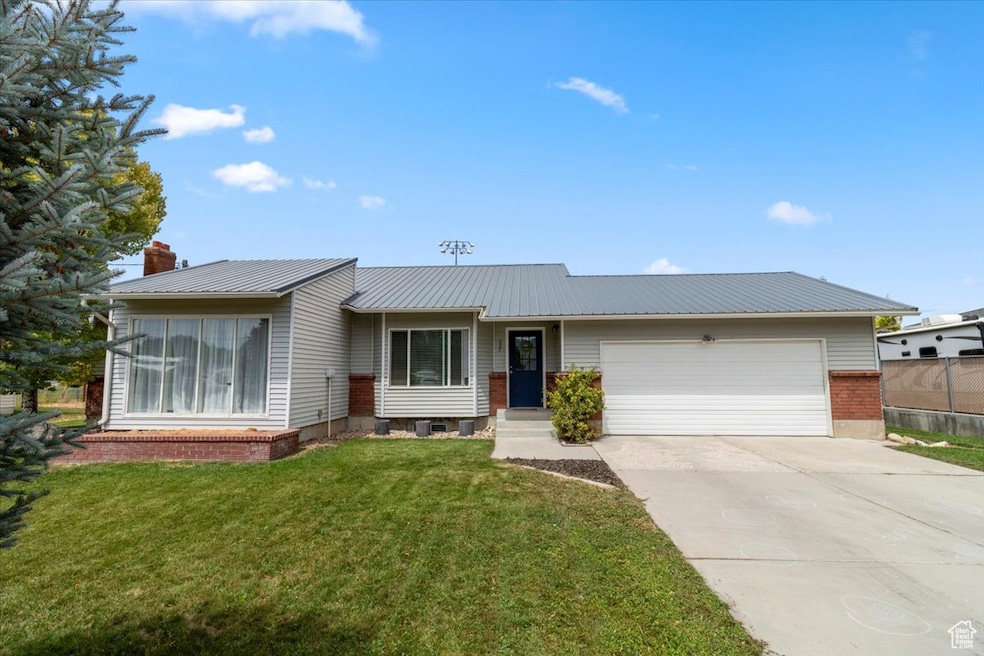
335 E 300 N Ephraim, UT 84627
Estimated payment $2,313/month
Highlights
- Fruit Trees
- Rambler Architecture
- No HOA
- Vaulted Ceiling
- Main Floor Primary Bedroom
- Den
About This Home
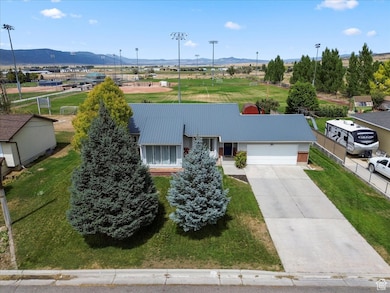
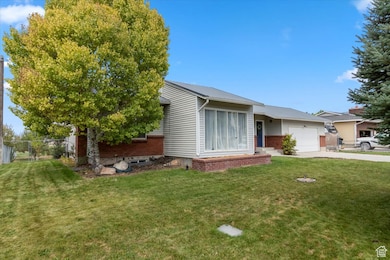
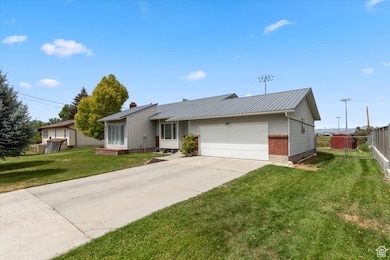
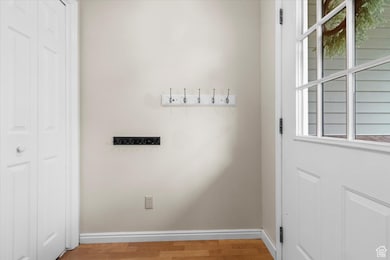
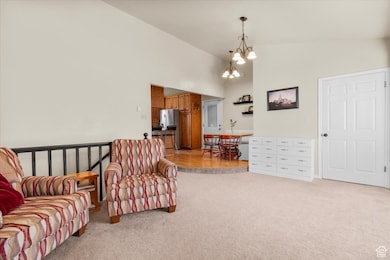
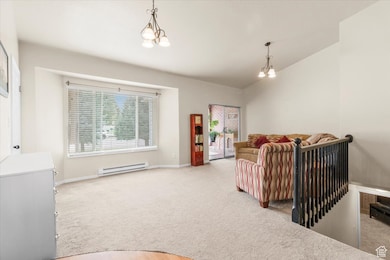
Well maintained home with a fully finished basement on a .31 acre lot in the heart of Ephraim. This property offers a comfortable and functional layout with an open concept main living area, vaulted ceilings, and a design that makes the home feel spacious and inviting. The primary suite features a remodeled bathroom with a custom tile shower, and both additional bathrooms were previously updated with tile and new surrounds. The home includes efficient Low E windows, LED lighting, baseboard heating, and a fully electric setup. With five spacious bedrooms, two family rooms, and a bright sunroom, there is plenty of room for both gathering and privacy. The covered back deck overlooks a landscaped yard with mountain views, garden beds, automatic sprinklers, fruit trees, a swing set, and a storage shed with no backyard neighbors! All kitchen appliances are included. This home has been well cared for and offers an ideal blend of space, comfort, and location.
Listing Agent
Haley Berry
Realty ONE Group Signature (South Valley) License #13507038 Listed on: 10/07/2025
Home Details
Home Type
- Single Family
Est. Annual Taxes
- $2,179
Year Built
- Built in 1985
Lot Details
- 0.31 Acre Lot
- South Facing Home
- Property is Fully Fenced
- Landscaped
- Sprinkler System
- Fruit Trees
- Vegetable Garden
- Property is zoned Single-Family
Parking
- 2 Car Attached Garage
Home Design
- Rambler Architecture
- Brick Exterior Construction
- Metal Roof
Interior Spaces
- 2,661 Sq Ft Home
- 2-Story Property
- Vaulted Ceiling
- Ceiling Fan
- Includes Fireplace Accessories
- Blinds
- Den
- Basement Fills Entire Space Under The House
- Disposal
- Electric Dryer Hookup
Flooring
- Carpet
- Linoleum
- Tile
Bedrooms and Bathrooms
- 5 Bedrooms | 3 Main Level Bedrooms
- Primary Bedroom on Main
Outdoor Features
- Exterior Lighting
- Storage Shed
- Play Equipment
- Porch
Schools
- Ephraim Elementary And Middle School
- Manti High School
Utilities
- Window Unit Cooling System
- Heating System Uses Wood
Community Details
- No Home Owners Association
- Ephraim Subdivision
Listing and Financial Details
- Exclusions: Dryer, Microwave, Washer
- Assessor Parcel Number 00000617X1
Map
Home Values in the Area
Average Home Value in this Area
Tax History
| Year | Tax Paid | Tax Assessment Tax Assessment Total Assessment is a certain percentage of the fair market value that is determined by local assessors to be the total taxable value of land and additions on the property. | Land | Improvement |
|---|---|---|---|---|
| 2025 | $2,169 | $210,181 | $0 | $0 |
| 2024 | $2,180 | $200,681 | $0 | $0 |
| 2023 | $2,150 | $188,433 | $0 | $0 |
| 2022 | $2,089 | $166,817 | $0 | $0 |
| 2021 | $2,029 | $140,008 | $0 | $0 |
| 2020 | $1,888 | $122,661 | $0 | $0 |
| 2019 | $1,783 | $114,001 | $0 | $0 |
| 2018 | $1,609 | $180,238 | $31,680 | $148,558 |
| 2017 | $1,348 | $86,948 | $0 | $0 |
| 2016 | $1,272 | $82,053 | $0 | $0 |
| 2015 | $1,278 | $82,053 | $0 | $0 |
| 2014 | $1,258 | $82,053 | $0 | $0 |
| 2013 | $1,252 | $82,053 | $0 | $0 |
Property History
| Date | Event | Price | List to Sale | Price per Sq Ft |
|---|---|---|---|---|
| 01/05/2026 01/05/26 | Price Changed | $415,000 | -2.4% | $156 / Sq Ft |
| 10/07/2025 10/07/25 | For Sale | $425,000 | -- | $160 / Sq Ft |
Source: UtahRealEstate.com
MLS Number: 2116103
Disclaimer: Certain information contained herein is derived from information provided by parties other than Homes.com. All information provided is deemed reliable, but is not guaranteed to be accurate and should be independently verified.
![]() IDX information is provided exclusively for consumers’ personal, non-commercial use, that it may not be used for any purpose other than to identify prospective properties consumers may be interested in purchasing, and that the data is deemed reliable but is not guaranteed accurate by the MLS. Licensor is only providing the MLS Content and not other sources of data provided in the Product.
IDX information is provided exclusively for consumers’ personal, non-commercial use, that it may not be used for any purpose other than to identify prospective properties consumers may be interested in purchasing, and that the data is deemed reliable but is not guaranteed accurate by the MLS. Licensor is only providing the MLS Content and not other sources of data provided in the Product.
Based on information from the Wasatch Front Regional Multiple Listing Service, Inc.. All data, including all measurements and calculations of area, is obtained from various sources and has not been, and will not be, verified by broker or the MLS. All information should be independently reviewed and verified for accuracy. Properties may or may not be listed by the office/agent presenting the information.
Ask me questions while you tour the home.