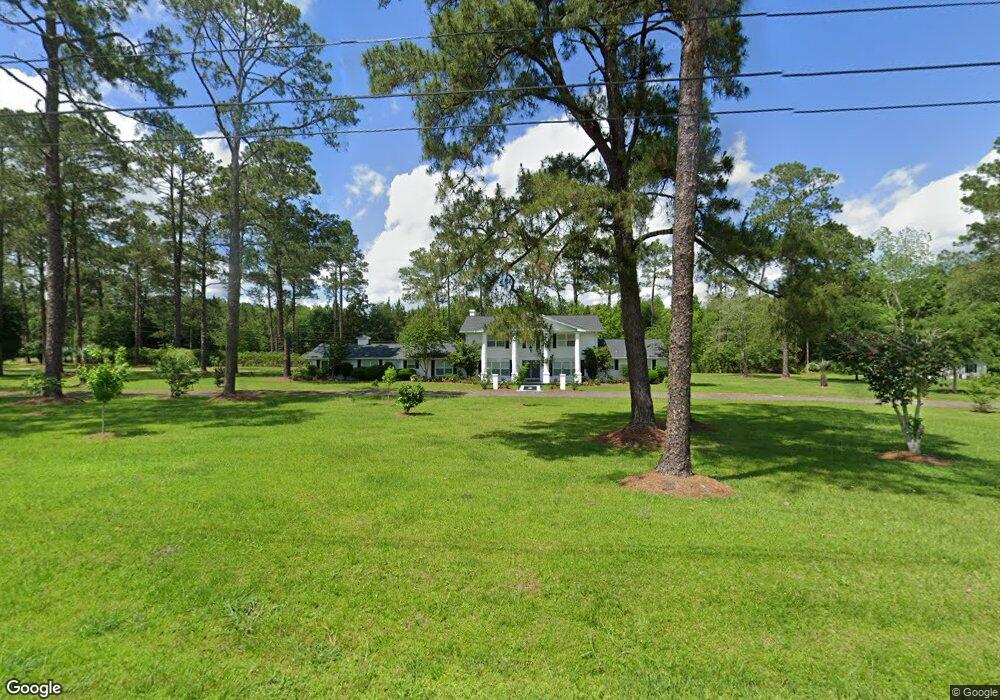
335 E Main St Barwick, GA 31720
Estimated Value: $362,000 - $613,000
5
Beds
7
Baths
5,100
Sq Ft
$96/Sq Ft
Est. Value
About This Home
This home is located at 335 E Main St, Barwick, GA 31720 and is currently estimated at $489,904, approximately $96 per square foot. 335 E Main St is a home located in Brooks County with nearby schools including North Brooks Elementary School.
Ownership History
Date
Name
Owned For
Owner Type
Purchase Details
Closed on
Mar 21, 2006
Sold by
Fergison Allen
Bought by
Hudoff Lary D and Hudoff Moscoso Eliana
Current Estimated Value
Home Financials for this Owner
Home Financials are based on the most recent Mortgage that was taken out on this home.
Original Mortgage
$283,200
Outstanding Balance
$183,533
Interest Rate
9%
Mortgage Type
New Conventional
Estimated Equity
$306,371
Purchase Details
Closed on
Jul 16, 1999
Sold by
Gehris Gilda Etal
Bought by
Gehris Clarence
Purchase Details
Closed on
Jun 21, 1994
Sold by
Ruby Turner W and Ruby Jones
Bought by
Gehris Gilda Etal
Create a Home Valuation Report for This Property
The Home Valuation Report is an in-depth analysis detailing your home's value as well as a comparison with similar homes in the area
Purchase History
| Date | Buyer | Sale Price | Title Company |
|---|---|---|---|
| Hudoff Lary D | $354,000 | -- | |
| Gehris Clarence | -- | -- | |
| Gehris Gilda Etal | $168,000 | -- |
Source: Public Records
Mortgage History
| Date | Status | Borrower | Loan Amount |
|---|---|---|---|
| Open | Hudoff Lary D | $283,200 | |
| Closed | Hudoff Lary D | $53,100 |
Source: Public Records
Tax History
| Year | Tax Paid | Tax Assessment Tax Assessment Total Assessment is a certain percentage of the fair market value that is determined by local assessors to be the total taxable value of land and additions on the property. | Land | Improvement |
|---|---|---|---|---|
| 2025 | $7,790 | $202,920 | $26,600 | $176,320 |
| 2024 | $7,676 | $199,880 | $23,560 | $176,320 |
| 2023 | $7,937 | $185,080 | $23,560 | $161,520 |
| 2022 | $1,763 | $53,280 | $23,320 | $29,960 |
| 2021 | $1,166 | $34,000 | $8,640 | $25,360 |
| 2020 | $1,412 | $33,760 | $8,640 | $25,120 |
| 2019 | $1,051 | $31,720 | $8,840 | $22,880 |
| 2018 | $1,366 | $31,720 | $8,840 | $22,880 |
| 2017 | $1,026 | $30,480 | $8,840 | $21,640 |
| 2016 | $1,017 | $30,480 | $8,840 | $21,640 |
| 2015 | -- | $31,120 | $8,840 | $22,280 |
| 2014 | -- | $37,000 | $8,840 | $28,160 |
| 2013 | -- | $61,848 | $8,840 | $53,008 |
Source: Public Records
Map
Nearby Homes
- 800 Clifford St
- 1038-BA Church St
- 2195 Coffee Rd
- 7402 Coffee Rd
- 431 Dry Lake Rd
- 9900 Ozell Rd
- 4265 Howard Rd
- 813 Vonier Rd
- 1065 W Harris St
- 581 Harris St
- 0000 0000 Ozell Road (15+ - Acres)
- 2773 Georgia 33
- 56 Egypt Rd Unit 10
- 0 Ozell Rd Unit 26629849
- 111 Nicole Britt Dr
- 106 Nicole Britt Dr
- 101 Bailey Cir
- 201 Bailey Cir
- 00000 Austin Lane (3 46 Acres)
- 536 N Leaphart St
Your Personal Tour Guide
Ask me questions while you tour the home.