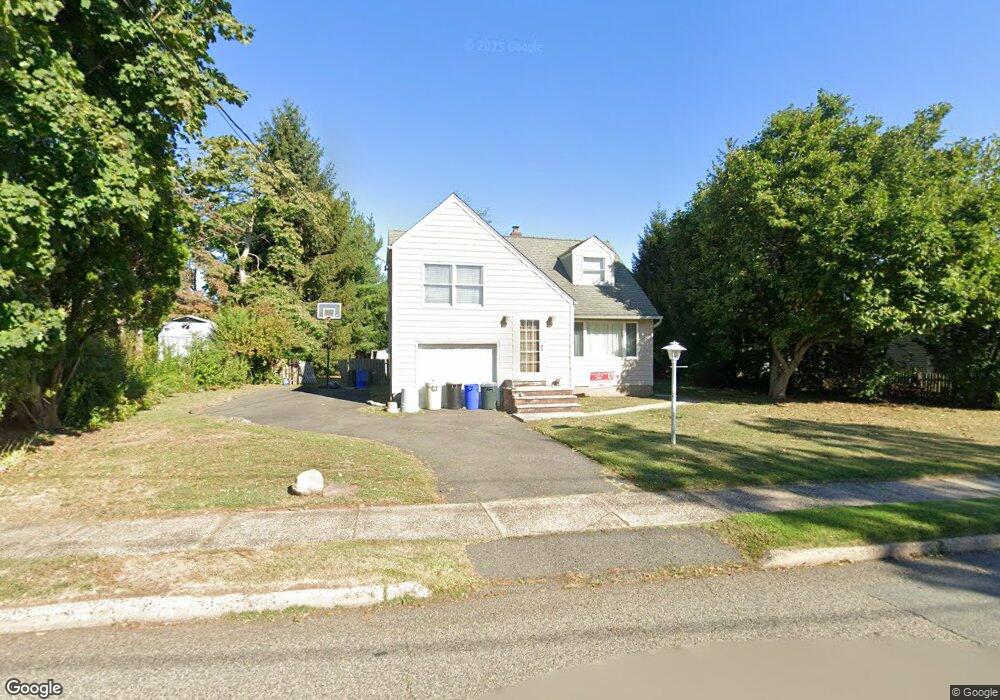
335 Floral Ln Saddle Brook, NJ 07663
Estimated Value: $582,957 - $635,000
--
Bed
--
Bath
1,206
Sq Ft
$511/Sq Ft
Est. Value
About This Home
This home is located at 335 Floral Ln, Saddle Brook, NJ 07663 and is currently estimated at $615,989, approximately $510 per square foot. 335 Floral Ln is a home located in Bergen County with nearby schools including Saddle Brook Mid High School and Noble Leadership Academy.
Ownership History
Date
Name
Owned For
Owner Type
Purchase Details
Closed on
Oct 20, 2004
Sold by
Stuchala Joseph
Bought by
Chap John and Chap Jennifer
Current Estimated Value
Home Financials for this Owner
Home Financials are based on the most recent Mortgage that was taken out on this home.
Original Mortgage
$284,000
Outstanding Balance
$140,368
Interest Rate
5.74%
Estimated Equity
$475,621
Purchase Details
Closed on
Aug 18, 1999
Sold by
Stuchala Joseph P and Estate Of Joseph J Stuchala
Bought by
Stuchala Joseph P
Create a Home Valuation Report for This Property
The Home Valuation Report is an in-depth analysis detailing your home's value as well as a comparison with similar homes in the area
Home Values in the Area
Average Home Value in this Area
Purchase History
| Date | Buyer | Sale Price | Title Company |
|---|---|---|---|
| Chap John | $355,000 | -- | |
| Stuchala Joseph P | -- | -- |
Source: Public Records
Mortgage History
| Date | Status | Borrower | Loan Amount |
|---|---|---|---|
| Open | Chap John | $284,000 |
Source: Public Records
Tax History Compared to Growth
Tax History
| Year | Tax Paid | Tax Assessment Tax Assessment Total Assessment is a certain percentage of the fair market value that is determined by local assessors to be the total taxable value of land and additions on the property. | Land | Improvement |
|---|---|---|---|---|
| 2025 | $9,602 | $426,800 | $252,900 | $173,900 |
| 2024 | $9,360 | $416,400 | $247,900 | $168,500 |
| 2023 | $9,135 | $400,700 | $240,400 | $160,300 |
| 2022 | $9,135 | $380,300 | $227,200 | $153,100 |
| 2021 | $8,339 | $337,900 | $195,700 | $142,200 |
| 2020 | $8,482 | $329,400 | $191,700 | $137,700 |
| 2019 | $8,339 | $321,600 | $189,200 | $132,400 |
| 2018 | $8,022 | $316,200 | $184,700 | $131,500 |
| 2017 | $8,018 | $311,000 | $182,200 | $128,800 |
| 2016 | $7,913 | $276,200 | $176,400 | $99,800 |
| 2015 | $7,499 | $276,200 | $176,400 | $99,800 |
| 2014 | $7,236 | $276,200 | $176,400 | $99,800 |
Source: Public Records
Map
Nearby Homes