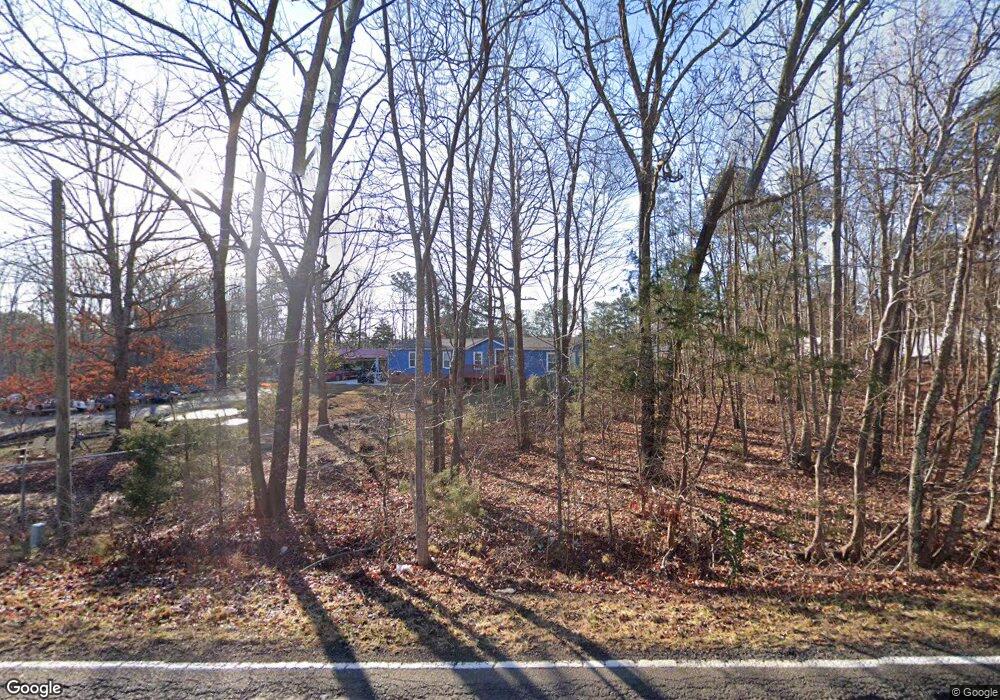
335 Hall Spencer Rd Catawba, SC 29704
Estimated Value: $89,000 - $368,000
--
Bed
--
Bath
1,456
Sq Ft
$173/Sq Ft
Est. Value
About This Home
This home is located at 335 Hall Spencer Rd, Catawba, SC 29704 and is currently estimated at $251,789, approximately $172 per square foot. 335 Hall Spencer Rd is a home located in York County with nearby schools including Mount Holly Elementary School, Castle Heights Middle School, and Rock Hill High School.
Ownership History
Date
Name
Owned For
Owner Type
Purchase Details
Closed on
Oct 3, 2014
Sold by
Lmb Resources Llc
Bought by
Gomez Basilio Sanchez
Current Estimated Value
Purchase Details
Closed on
Jul 9, 2014
Sold by
Lampinstein Eric H
Bought by
Lmb Resources Llc
Purchase Details
Closed on
Dec 2, 2013
Sold by
Sealy Christy L and Leiva Richard
Bought by
Lampinstein Eric H
Purchase Details
Closed on
Jun 16, 2007
Sold by
Sealy Anthony
Bought by
Leiva Richard
Purchase Details
Closed on
Jul 22, 2005
Sold by
Clark Richard N and Clark Guy L
Bought by
Clark Edgar E
Purchase Details
Closed on
Jul 15, 2005
Sold by
Inman Ii R M and Clark Johnson H
Bought by
Sealy Anthony J and Sealy Christy L
Purchase Details
Closed on
Feb 5, 2004
Sold by
Chase Manhattan Mortgage Corp
Bought by
Inman R M and Clarke Johnson H
Purchase Details
Closed on
Jun 10, 2003
Sold by
Blue Karen D
Bought by
Chase Manhattan Mortgage Corp
Create a Home Valuation Report for This Property
The Home Valuation Report is an in-depth analysis detailing your home's value as well as a comparison with similar homes in the area
Home Values in the Area
Average Home Value in this Area
Purchase History
| Date | Buyer | Sale Price | Title Company |
|---|---|---|---|
| Gomez Basilio Sanchez | $9,250 | -- | |
| Lmb Resources Llc | $6,000 | -- | |
| Lampinstein Eric H | $4,000 | -- | |
| Leiva Richard | $500 | None Available | |
| Leiva Richard | -- | None Available | |
| Clark Edgar E | -- | -- | |
| Sealy Anthony J | $62,900 | -- | |
| Inman R M | $32,500 | -- | |
| Chase Manhattan Mortgage Corp | $2,500 | -- |
Source: Public Records
Tax History Compared to Growth
Tax History
| Year | Tax Paid | Tax Assessment Tax Assessment Total Assessment is a certain percentage of the fair market value that is determined by local assessors to be the total taxable value of land and additions on the property. | Land | Improvement |
|---|---|---|---|---|
| 2024 | $1,313 | $3,612 | $2,160 | $1,452 |
| 2023 | $1,326 | $3,612 | $2,160 | $1,452 |
| 2022 | $1,248 | $3,612 | $2,160 | $1,452 |
| 2021 | -- | $3,612 | $2,160 | $1,452 |
| 2020 | $1,213 | $3,612 | $0 | $0 |
| 2019 | $1,143 | $3,300 | $0 | $0 |
| 2018 | $1,119 | $3,300 | $0 | $0 |
| 2017 | $1,071 | $3,300 | $0 | $0 |
| 2016 | $1,037 | $3,300 | $0 | $0 |
| 2014 | $291 | $3,300 | $1,680 | $1,620 |
| 2013 | $291 | $3,480 | $1,680 | $1,800 |
Source: Public Records
Map
Nearby Homes
- 925 Four Cross Rd
- 4575 Cureton Ferry Rd
- 00 Whispering Pines Dr Unit 31
- TBD Railroad Rd
- 0000 Tract #1A Roddey Rd
- 4001 Lesslie Hwy
- 3215 Shadybark Trail
- Lot 44 Woodglenn Rd
- 4000 Lesslie Hwy
- 686 Cannon Dr
- 1009 Rainbow Cir
- 3886 Lesslie Hwy
- 5245 Highway 5 None
- 3835 Lesslie Hwy
- 355 Leisure Ln
- 574 Karen Dr
- 903 Rowells Rd
- 2870 Harmony Rd
- Lot 2 Ratteree Farm Rd Unit 2
- 57 Acres Woodstock Dr
- 953 Four Cross Rd
- 289 Hall Spencer Rd
- 00 4 Cross Rd
- 275 Hall Spencer Rd
- 4950 Four Cross Rd
- 946 Four Cross Rd
- 4910 Huntington Farms Rd
- 398 Nora Ridge
- 386 Nora Ridge
- Lot 8 Huntington Farms Rd
- 241 Hall Spencer Rd
- 4930 Huntington Farm Rd
- 234 Dot Faris Rd
- 233 Dot Faris Rd
- 374 Nora Ridge
- 235 Hall Spencer Rd
- 387 Nora Ridge
- 4929 Huntington Farm Rd
- 375 Nora Ridge Unit 10
- 432 Hall Spencer Rd