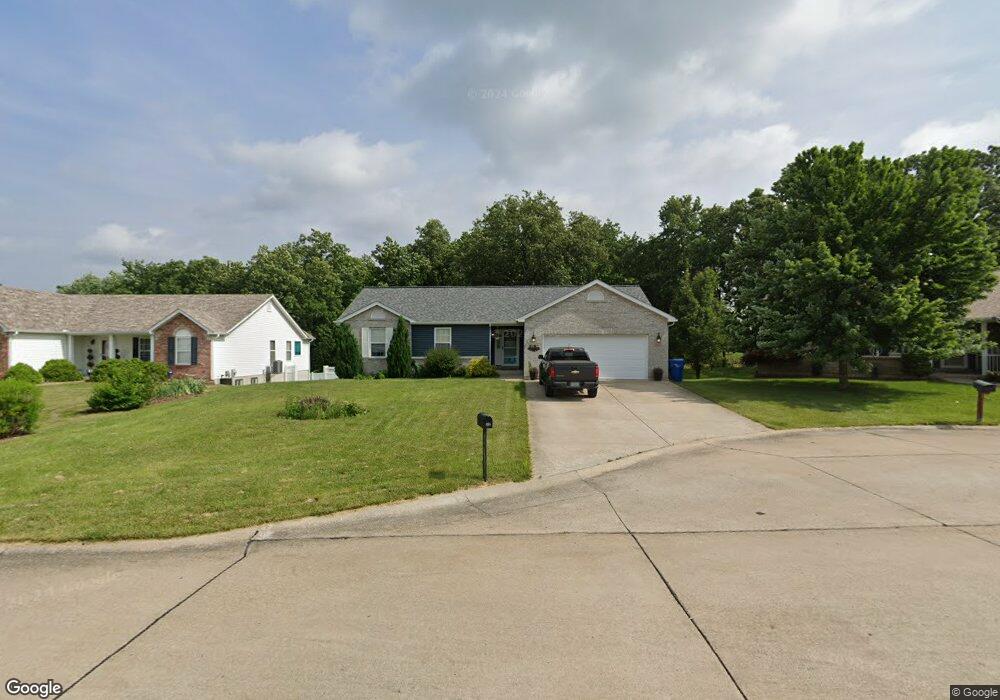
335 Hunters Chase St Winfield, MO 63389
Estimated Value: $268,373 - $286,000
3
Beds
2
Baths
1,350
Sq Ft
$203/Sq Ft
Est. Value
About This Home
This home is located at 335 Hunters Chase St, Winfield, MO 63389 and is currently estimated at $273,593, approximately $202 per square foot. 335 Hunters Chase St is a home located in Lincoln County with nearby schools including Cuivre Park Elementary School, Troy Middle School, and Troy Buchanan High School.
Ownership History
Date
Name
Owned For
Owner Type
Purchase Details
Closed on
Feb 20, 2019
Sold by
Haas Juanita S and Haas Richard Raymond
Bought by
Haas Scott L and Haas Jennifer L
Current Estimated Value
Home Financials for this Owner
Home Financials are based on the most recent Mortgage that was taken out on this home.
Original Mortgage
$12,500
Interest Rate
3.8%
Mortgage Type
Commercial
Purchase Details
Closed on
Oct 6, 2017
Sold by
East Missouri Development Llc
Bought by
Haas Juanita S
Home Financials for this Owner
Home Financials are based on the most recent Mortgage that was taken out on this home.
Original Mortgage
$127,645
Interest Rate
3.86%
Mortgage Type
FHA
Purchase Details
Closed on
Feb 29, 2008
Sold by
East Missouri Development Llc
Bought by
Lvy Christopher D and Lvy Sabrina E
Purchase Details
Closed on
Jan 29, 2008
Sold by
Ivy Christopher D and Ivy Sabrina E
Bought by
East Missouri Development Llc
Create a Home Valuation Report for This Property
The Home Valuation Report is an in-depth analysis detailing your home's value as well as a comparison with similar homes in the area
Home Values in the Area
Average Home Value in this Area
Purchase History
| Date | Buyer | Sale Price | Title Company |
|---|---|---|---|
| Haas Scott L | -- | Meyer Title Company | |
| Haas Juanita S | -- | Meyer Title Co | |
| Lvy Christopher D | $164,000 | None Available | |
| East Missouri Development Llc | -- | Meyer Title Company |
Source: Public Records
Mortgage History
| Date | Status | Borrower | Loan Amount |
|---|---|---|---|
| Open | Haas Scott L | $12,500 | |
| Previous Owner | Haas Juanita S | $127,645 |
Source: Public Records
Tax History Compared to Growth
Tax History
| Year | Tax Paid | Tax Assessment Tax Assessment Total Assessment is a certain percentage of the fair market value that is determined by local assessors to be the total taxable value of land and additions on the property. | Land | Improvement |
|---|---|---|---|---|
| 2025 | $1,906 | $32,981 | $5,765 | $27,216 |
| 2024 | $1,906 | $30,592 | $5,166 | $25,426 |
| 2023 | $1,858 | $29,984 | $5,166 | $24,818 |
| 2022 | $1,763 | $28,312 | $5,166 | $23,146 |
| 2021 | $1,773 | $149,010 | $0 | $0 |
| 2020 | $1,573 | $132,110 | $0 | $0 |
| 2019 | $1,572 | $131,920 | $0 | $0 |
| 2018 | $1,605 | $25,274 | $0 | $0 |
| 2017 | $1,609 | $25,274 | $0 | $0 |
| 2016 | $1,478 | $22,639 | $0 | $0 |
| 2015 | $1,482 | $22,639 | $0 | $0 |
| 2014 | -- | $22,825 | $0 | $0 |
| 2013 | -- | $22,825 | $0 | $0 |
Source: Public Records
Map
Nearby Homes
- 101 Equestrian Dr
- 184 Equestrian Dr
- 196 Equestrian Dr
- 114 Quail Trail
- 76 Lloyd Ln
- 440 Winchester Way
- 230 Hammett Rd
- 3218 S Highway W - Lot 6
- 3218 S Highway W - Lot 5
- 3218 S Highway - Lot 4
- 3218 S Highway - Lot 3
- 108 Linder Ln
- 0 Lot #5 217 Red Mare Rd Unit MAR25024251
- 3218 S Highway W - Lot 7
- 0 Lot #1 216 Red Mare Rd Unit MAR25024210
- 3218 S Highway - Lot 1
- 3218 S Highway - Lot 2
- 0 Lot #4 225 Red Mare Rd Unit MAR25024237
- 0 Lot #3 233 Red Mare Rd Unit MAR25024231
- 149 Colton Jesse Dr
- 325 Hunters Chase St
- 345 Hunters Chase St
- 300 Hunters Chase St
- 340 Hunters Chase St
- 315 Hunters Chase St
- 305 Hunters Chase St
- 280 Hunters Chase St
- 295 Hunters Chase St
- 3523 S Highway W
- 285 Hunters Chase St
- 270 Hunters Chase St
- 3517 S Highway W
- 4 Overlook Place
- 275 Hunters Chase St
- 260 Hunters Chase St
- 3 Overlook Place
- 265 Hunters Chase St
- 11 Grayhawk Dr
- 2 Overlook Place
- 250 Hunters Chase St