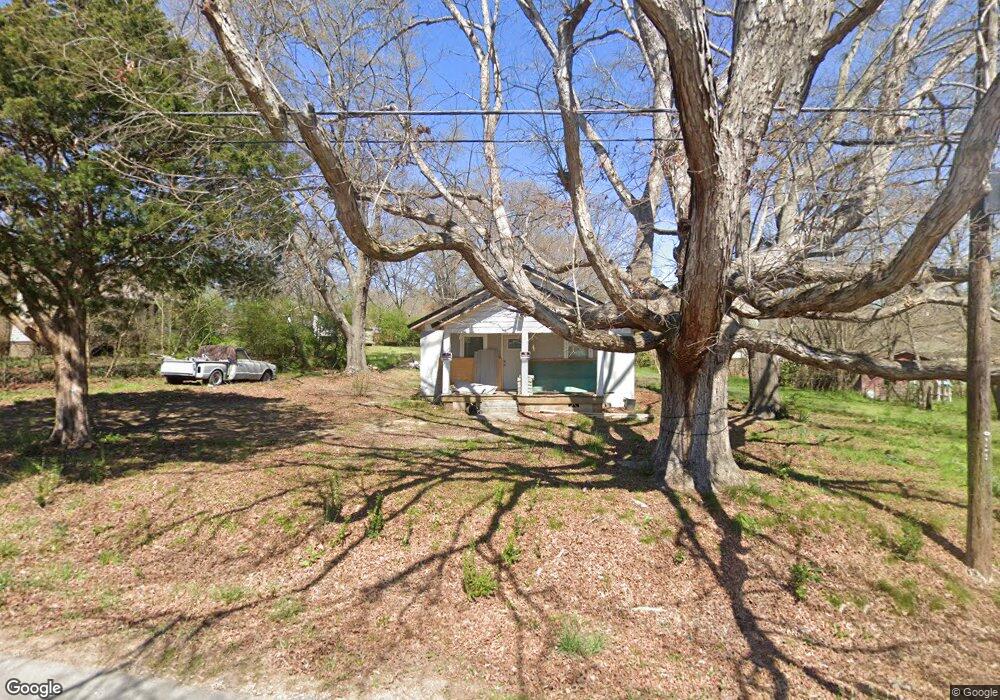
335 Mcarthur St Cedartown, GA 30125
Estimated Value: $59,000 - $118,000
3
Beds
1
Bath
1,090
Sq Ft
$77/Sq Ft
Est. Value
About This Home
This home is located at 335 Mcarthur St, Cedartown, GA 30125 and is currently estimated at $83,493, approximately $76 per square foot. 335 Mcarthur St is a home with nearby schools including Cedar Christian School.
Ownership History
Date
Name
Owned For
Owner Type
Purchase Details
Closed on
Feb 18, 2021
Sold by
Lester Donya C
Bought by
Franklin Raquel Amber Noel and Lopez Cordero Jose
Current Estimated Value
Home Financials for this Owner
Home Financials are based on the most recent Mortgage that was taken out on this home.
Original Mortgage
$28,000
Outstanding Balance
$9,795
Interest Rate
2.7%
Mortgage Type
New Conventional
Estimated Equity
$73,698
Purchase Details
Closed on
Jun 8, 2019
Sold by
Executor East Mary E
Bought by
East Mary E
Purchase Details
Closed on
Mar 19, 2018
Sold by
Lester Mollie M
Bought by
Lester Donya C
Purchase Details
Closed on
Mar 10, 2011
Sold by
Lester Lelon Cecil
Bought by
Lester Lelon Cecil
Purchase Details
Closed on
Jul 27, 1992
Sold by
Lester Cecil and Lester A* H
Bought by
M Lester C and M M
Purchase Details
Closed on
Jan 1, 1974
Bought by
Lester E C
Purchase Details
Closed on
Sep 27, 1945
Bought by
Lester E C
Create a Home Valuation Report for This Property
The Home Valuation Report is an in-depth analysis detailing your home's value as well as a comparison with similar homes in the area
Home Values in the Area
Average Home Value in this Area
Purchase History
| Date | Buyer | Sale Price | Title Company |
|---|---|---|---|
| Franklin Raquel Amber Noel | $35,000 | -- | |
| East Mary E | -- | -- | |
| Lester Donya C | -- | -- | |
| Lester Lelon Cecil | -- | -- | |
| M Lester C | $8,000 | -- | |
| Lester E C | -- | -- | |
| Lester E C | -- | -- |
Source: Public Records
Mortgage History
| Date | Status | Borrower | Loan Amount |
|---|---|---|---|
| Open | Franklin Raquel Amber Noel | $28,000 |
Source: Public Records
Tax History Compared to Growth
Tax History
| Year | Tax Paid | Tax Assessment Tax Assessment Total Assessment is a certain percentage of the fair market value that is determined by local assessors to be the total taxable value of land and additions on the property. | Land | Improvement |
|---|---|---|---|---|
| 2024 | $478 | $22,852 | $2,200 | $20,652 |
| 2023 | $372 | $15,670 | $814 | $14,856 |
| 2022 | $317 | $13,366 | $814 | $12,552 |
| 2021 | $321 | $13,366 | $814 | $12,552 |
| 2020 | $322 | $13,366 | $814 | $12,552 |
| 2019 | $284 | $10,578 | $1,668 | $8,910 |
| 2018 | $276 | $10,013 | $1,430 | $8,583 |
| 2017 | $272 | $10,013 | $1,430 | $8,583 |
| 2016 | $272 | $10,012 | $1,430 | $8,583 |
| 2015 | $276 | $10,098 | $1,430 | $8,669 |
| 2014 | $280 | $10,187 | $1,668 | $8,519 |
Source: Public Records
Map
Nearby Homes