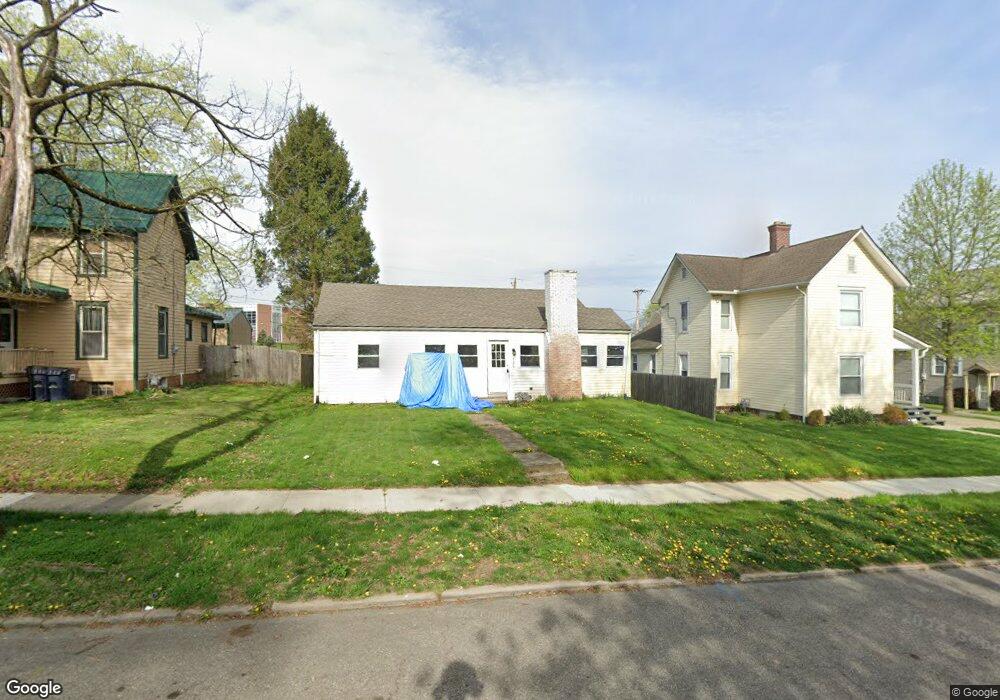
335 N 11th St Newark, OH 43055
Estimated Value: $151,000 - $180,000
3
Beds
1
Bath
912
Sq Ft
$179/Sq Ft
Est. Value
About This Home
This home is located at 335 N 11th St, Newark, OH 43055 and is currently estimated at $163,536, approximately $179 per square foot. 335 N 11th St is a home located in Licking County with nearby schools including John Clem Elementary School, Liberty Middle School, and Newark High School.
Ownership History
Date
Name
Owned For
Owner Type
Purchase Details
Closed on
Aug 7, 2020
Sold by
Woods Adjuane
Bought by
State Of Ohio
Current Estimated Value
Purchase Details
Closed on
Jul 31, 2019
Sold by
Markle Charles A
Bought by
Woods Adjuane
Purchase Details
Closed on
Jul 31, 2009
Sold by
Secretary Of Housing & Urban Development
Bought by
Markle Charles A
Purchase Details
Closed on
Dec 2, 2008
Sold by
Wells Fargo Bank Na
Bought by
Secretary Of Housing & Urban Development
Purchase Details
Closed on
Oct 3, 2008
Sold by
Riggleman Stephen R
Bought by
Wells Fargo Bank Na
Purchase Details
Closed on
May 26, 1999
Sold by
Smith Michael T
Bought by
Riggleman Stephen R
Home Financials for this Owner
Home Financials are based on the most recent Mortgage that was taken out on this home.
Original Mortgage
$50,350
Interest Rate
6.92%
Mortgage Type
FHA
Create a Home Valuation Report for This Property
The Home Valuation Report is an in-depth analysis detailing your home's value as well as a comparison with similar homes in the area
Home Values in the Area
Average Home Value in this Area
Purchase History
| Date | Buyer | Sale Price | Title Company |
|---|---|---|---|
| State Of Ohio | -- | None Available | |
| Woods Adjuane | $25,000 | None Available | |
| Markle Charles A | $25,556 | Lakeside Title & Escrow Agen | |
| Secretary Of Housing & Urban Development | -- | None Available | |
| Wells Fargo Bank Na | $46,667 | None Available | |
| Riggleman Stephen R | $49,900 | -- |
Source: Public Records
Mortgage History
| Date | Status | Borrower | Loan Amount |
|---|---|---|---|
| Previous Owner | Riggleman Stephen R | $50,350 |
Source: Public Records
Tax History Compared to Growth
Tax History
| Year | Tax Paid | Tax Assessment Tax Assessment Total Assessment is a certain percentage of the fair market value that is determined by local assessors to be the total taxable value of land and additions on the property. | Land | Improvement |
|---|---|---|---|---|
| 2024 | $1,521 | $41,440 | $13,440 | $28,000 |
| 2023 | $1,594 | $41,440 | $13,440 | $28,000 |
| 2022 | $1,173 | $28,460 | $7,560 | $20,900 |
| 2021 | $1,230 | $28,460 | $7,560 | $20,900 |
| 2020 | $1,258 | $28,460 | $7,560 | $20,900 |
| 2019 | $1,028 | $22,370 | $6,300 | $16,070 |
| 2018 | $1,183 | $0 | $0 | $0 |
| 2017 | $855 | $0 | $0 | $0 |
| 2016 | $710 | $0 | $0 | $0 |
| 2015 | $725 | $0 | $0 | $0 |
| 2014 | $903 | $0 | $0 | $0 |
| 2013 | $1,144 | $0 | $0 | $0 |
Source: Public Records
Map
Nearby Homes
- 333 N 10th St
- 425 N 11th St
- 355 Eddy St
- 361 Granville St
- 383 Central Ave
- 408 Granville St
- 64 N 10th St
- 218 Granville St
- 69 Wallace St
- 251 Merchant St
- 247 Buckingham St
- 467 Mount Vernon Rd
- 533 Leslie Dr
- 27 W North St
- 542 Mount Vernon Rd
- 188 Meadow Dr
- 184 Meadow Dr
- 423 Hudson Ave
- 355 Hudson Ave
- 249 W Locust St