Estimated Value: $241,000 - $281,000
5
Beds
2
Baths
1,809
Sq Ft
$144/Sq Ft
Est. Value
About This Home
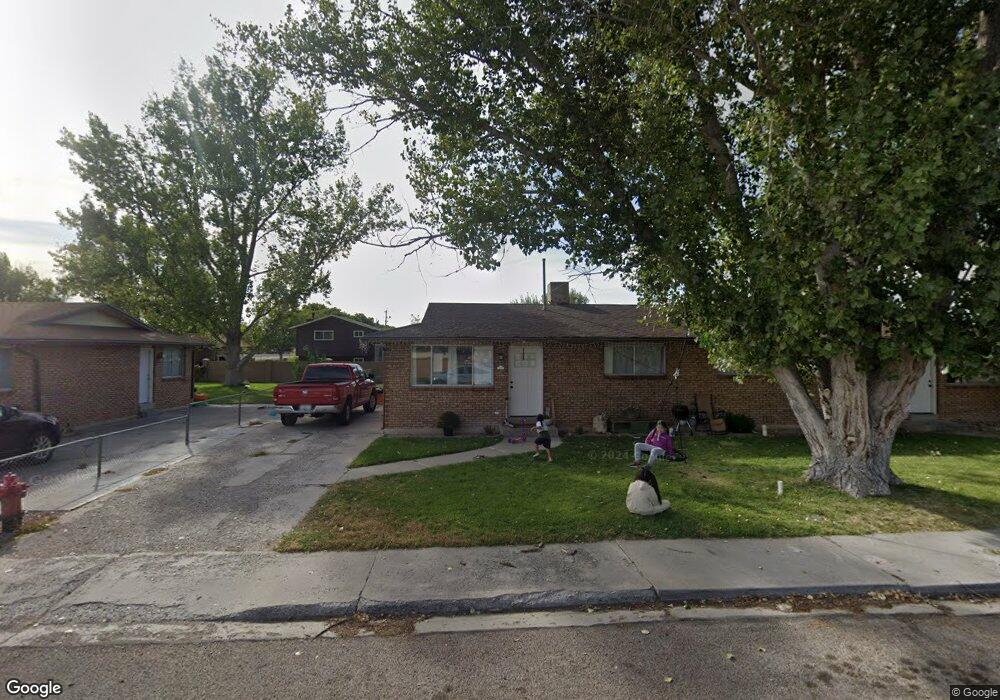
This home is located at 335 N 390 E, Delta, UT 84624 and is currently estimated at $261,000, approximately $144 per square foot. 335 N 390 E is a home located in Millard County with nearby schools including Cba Center and White River Academy.
Ownership History
Date
Name
Owned For
Owner Type
Purchase Details
Closed on
May 31, 2018
Sold by
Abbott Jake
Bought by
Christensen Colin Thomas
Current Estimated Value
Home Financials for this Owner
Home Financials are based on the most recent Mortgage that was taken out on this home.
Original Mortgage
$122,735
Outstanding Balance
$104,113
Interest Rate
3.87%
Mortgage Type
FHA
Estimated Equity
$156,887
Purchase Details
Closed on
Jul 29, 2011
Sold by
Olcott Rodney L
Bought by
Abbott Jake
Home Financials for this Owner
Home Financials are based on the most recent Mortgage that was taken out on this home.
Original Mortgage
$110,622
Interest Rate
4.5%
Mortgage Type
FHA
Purchase Details
Closed on
Nov 3, 2006
Sold by
Jensen Joan N
Bought by
Olcott Rodney L
Home Financials for this Owner
Home Financials are based on the most recent Mortgage that was taken out on this home.
Original Mortgage
$12,000
Interest Rate
6.28%
Mortgage Type
Future Advance Clause Open End Mortgage
Create a Home Valuation Report for This Property
The Home Valuation Report is an in-depth analysis detailing your home's value as well as a comparison with similar homes in the area
Home Values in the Area
Average Home Value in this Area
Purchase History
| Date | Buyer | Sale Price | Title Company |
|---|---|---|---|
| Christensen Colin Thomas | -- | None Available | |
| Abbott Jake | -- | -- | |
| Olcott Rodney L | -- | -- |
Source: Public Records
Mortgage History
| Date | Status | Borrower | Loan Amount |
|---|---|---|---|
| Open | Christensen Colin Thomas | $122,735 | |
| Previous Owner | Abbott Jake | $110,622 | |
| Previous Owner | Olcott Rodney L | $12,000 |
Source: Public Records
Tax History
| Year | Tax Paid | Tax Assessment Tax Assessment Total Assessment is a certain percentage of the fair market value that is determined by local assessors to be the total taxable value of land and additions on the property. | Land | Improvement |
|---|---|---|---|---|
| 2025 | $1,664 | $177,878 | $16,379 | $161,499 |
| 2024 | $1,664 | $120,658 | $14,816 | $105,842 |
| 2023 | $1,342 | $120,658 | $14,816 | $105,842 |
| 2022 | $1,324 | $99,565 | $13,469 | $86,096 |
| 2021 | $913 | $65,522 | $11,712 | $53,810 |
| 2020 | $904 | $64,457 | $10,647 | $53,810 |
| 2019 | $870 | $62,113 | $10,337 | $51,776 |
| 2018 | $769 | $55,360 | $10,337 | $45,023 |
| 2017 | $799 | $55,360 | $10,337 | $45,023 |
| 2016 | $773 | $55,360 | $10,337 | $45,023 |
| 2015 | $773 | $55,360 | $10,337 | $45,023 |
| 2014 | -- | $47,904 | $10,337 | $37,567 |
| 2013 | -- | $47,904 | $10,337 | $37,567 |
Source: Public Records
Map
Nearby Homes
- 7900 E 250 Rd N
- 520 E 450 North Rd
- 445 Topaz Blvd Unit 10
- 628 Sunset St
- 0 E Highway 6 Unit LotWP001 16586023
- 901 E 750 Rd N
- 44 E 300 S
- 87 S 300 East Rd
- 325 N 100 W
- 321 E 200 S
- Locust Ave Unit LotWP001
- 163 W 100 S
- 38 E 300 S
- 32 E 300 S
- 648 Tamarix St
- 98 W 1000 N
- 451 W 300 N
- 341 W 100 S
- 700 N Highway 6
- 294 S 300 W
Your Personal Tour Guide
Ask me questions while you tour the home.