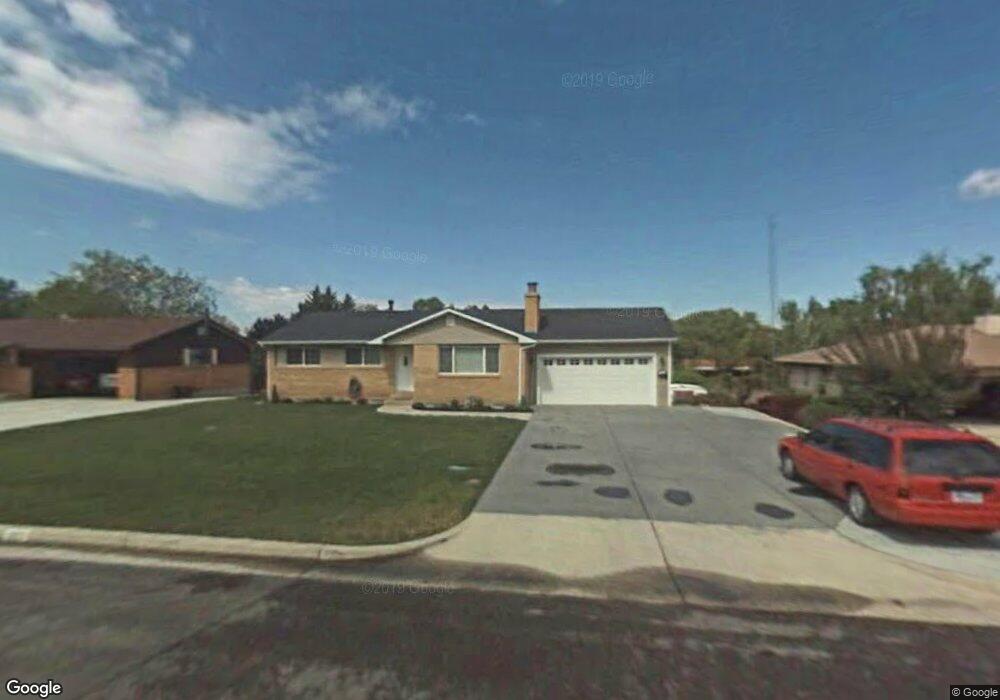
335 N 400 E Brigham City, UT 84302
Estimated Value: $401,000 - $432,000
Studio
--
Bath
1,163
Sq Ft
$358/Sq Ft
Est. Value
About This Home
This home is located at 335 N 400 E, Brigham City, UT 84302 and is currently estimated at $416,818, approximately $358 per square foot. 335 N 400 E is a home located in Box Elder County with nearby schools including Golden Spike Elementary, Box Elder Middle School, and Adele C. Young Intermediate School.
Ownership History
Date
Name
Owned For
Owner Type
Purchase Details
Closed on
Jul 18, 2012
Sold by
Valberg Tyler E
Bought by
Valberg Tyler E and Valberg Julie A
Current Estimated Value
Home Financials for this Owner
Home Financials are based on the most recent Mortgage that was taken out on this home.
Original Mortgage
$174,300
Outstanding Balance
$120,203
Interest Rate
3.65%
Mortgage Type
New Conventional
Estimated Equity
$296,615
Purchase Details
Closed on
Dec 19, 2007
Sold by
Valberg John E and Valberg Carol R
Bought by
Valberg Tyler E
Home Financials for this Owner
Home Financials are based on the most recent Mortgage that was taken out on this home.
Original Mortgage
$180,000
Interest Rate
6.2%
Mortgage Type
New Conventional
Purchase Details
Closed on
Apr 19, 2007
Sold by
Leavitt Laurie
Bought by
Valberg Jon E and Valberg Carol R
Purchase Details
Closed on
Feb 28, 2007
Sold by
Leavitt Brian
Bought by
Leavitt Laurie
Create a Home Valuation Report for This Property
The Home Valuation Report is an in-depth analysis detailing your home's value as well as a comparison with similar homes in the area
Purchase History
| Date | Buyer | Sale Price | Title Company |
|---|---|---|---|
| Valberg Tyler E | -- | Hickman Land Title Co | |
| Valberg Tyler E | -- | -- | |
| Valberg Jon E | -- | None Available | |
| Leavitt Laurie | -- | None Available |
Source: Public Records
Mortgage History
| Date | Status | Borrower | Loan Amount |
|---|---|---|---|
| Open | Valberg Tyler E | $174,300 | |
| Closed | Valberg Tyler E | $180,000 |
Source: Public Records
Tax History
| Year | Tax Paid | Tax Assessment Tax Assessment Total Assessment is a certain percentage of the fair market value that is determined by local assessors to be the total taxable value of land and additions on the property. | Land | Improvement |
|---|---|---|---|---|
| 2025 | $2,337 | $401,904 | $105,000 | $296,904 |
| 2024 | $2,051 | $394,911 | $100,000 | $294,911 |
| 2023 | $2,012 | $396,632 | $95,000 | $301,632 |
| 2022 | $2,028 | $204,421 | $22,000 | $182,421 |
| 2021 | $1,540 | $231,236 | $40,000 | $191,236 |
| 2020 | $1,423 | $231,236 | $40,000 | $191,236 |
| 2019 | $1,331 | $115,079 | $22,000 | $93,079 |
| 2018 | $1,198 | $102,939 | $22,000 | $80,939 |
| 2017 | $1,052 | $156,569 | $16,500 | $126,569 |
| 2016 | $1,100 | $82,798 | $16,500 | $66,298 |
| 2015 | $1,020 | $76,771 | $16,500 | $60,271 |
| 2014 | $1,020 | $73,901 | $16,500 | $57,401 |
| 2013 | -- | $73,901 | $16,500 | $57,401 |
Source: Public Records
Map
Nearby Homes
Your Personal Tour Guide
Ask me questions while you tour the home.