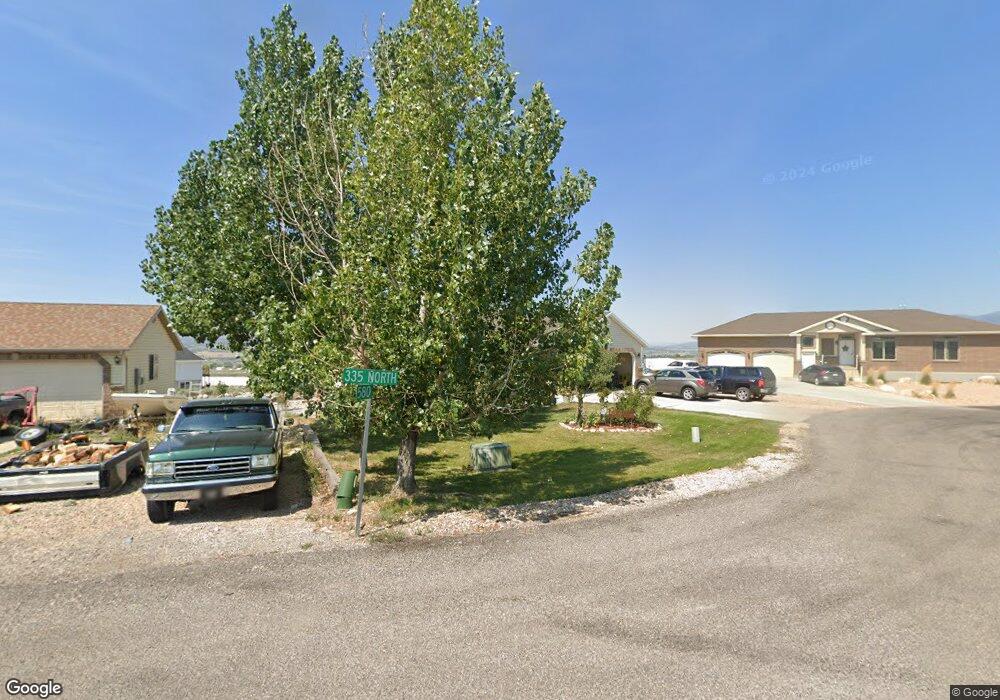
335 N 601 E Mount Pleasant, UT 84647
Estimated Value: $369,177 - $482,000
Studio
--
Bath
2,614
Sq Ft
$166/Sq Ft
Est. Value
About This Home
This home is located at 335 N 601 E, Mount Pleasant, UT 84647 and is currently estimated at $434,294, approximately $166 per square foot. 335 N 601 E is a home with nearby schools including North Sanpete High School and Wasatch Academy.
Ownership History
Date
Name
Owned For
Owner Type
Purchase Details
Closed on
Jan 5, 2017
Sold by
Tyler White
Bought by
Rosenlof Randy
Current Estimated Value
Home Financials for this Owner
Home Financials are based on the most recent Mortgage that was taken out on this home.
Original Mortgage
$103,000
Outstanding Balance
$84,033
Interest Rate
4.03%
Mortgage Type
New Conventional
Estimated Equity
$350,261
Purchase Details
Closed on
Sep 21, 2006
Sold by
Mikkelsen Brett and Walker Jeffrey W
Bought by
White Tyler
Purchase Details
Closed on
Mar 24, 2006
Sold by
C & J Walker & Sons Inc
Bought by
Mikkelsen Brett and Mikkelsen Jeffrey W
Purchase Details
Closed on
Jul 27, 2005
Sold by
P & E Ltd Partnership
Bought by
Mikkelsen Brett
Create a Home Valuation Report for This Property
The Home Valuation Report is an in-depth analysis detailing your home's value as well as a comparison with similar homes in the area
Home Values in the Area
Average Home Value in this Area
Purchase History
| Date | Buyer | Sale Price | Title Company |
|---|---|---|---|
| Rosenlof Randy | $128,750 | D Land Title | |
| White Tyler | -- | -- | |
| Mikkelsen Brett | -- | -- | |
| Mikkelsen Brett | -- | -- |
Source: Public Records
Mortgage History
| Date | Status | Borrower | Loan Amount |
|---|---|---|---|
| Open | Rosenlof Randy | $103,000 |
Source: Public Records
Tax History
| Year | Tax Paid | Tax Assessment Tax Assessment Total Assessment is a certain percentage of the fair market value that is determined by local assessors to be the total taxable value of land and additions on the property. | Land | Improvement |
|---|---|---|---|---|
| 2025 | $1,891 | $213,690 | $0 | $0 |
| 2024 | $1,913 | $203,837 | $0 | $0 |
| 2023 | $1,867 | $191,396 | $0 | $0 |
| 2022 | $1,869 | $170,890 | $0 | $0 |
| 2021 | $1,821 | $151,097 | $0 | $0 |
| 2020 | $1,712 | $129,420 | $0 | $0 |
| 2019 | $1,687 | $120,117 | $0 | $0 |
| 2018 | $1,548 | $189,909 | $24,432 | $165,477 |
| 2017 | $1,261 | $86,290 | $0 | $0 |
| 2016 | $1,171 | $80,085 | $0 | $0 |
| 2015 | $1,178 | $80,085 | $0 | $0 |
| 2014 | $1,202 | $80,085 | $0 | $0 |
| 2013 | $1,130 | $80,085 | $0 | $0 |
Source: Public Records
Map
Nearby Homes
Your Personal Tour Guide
Ask me questions while you tour the home.