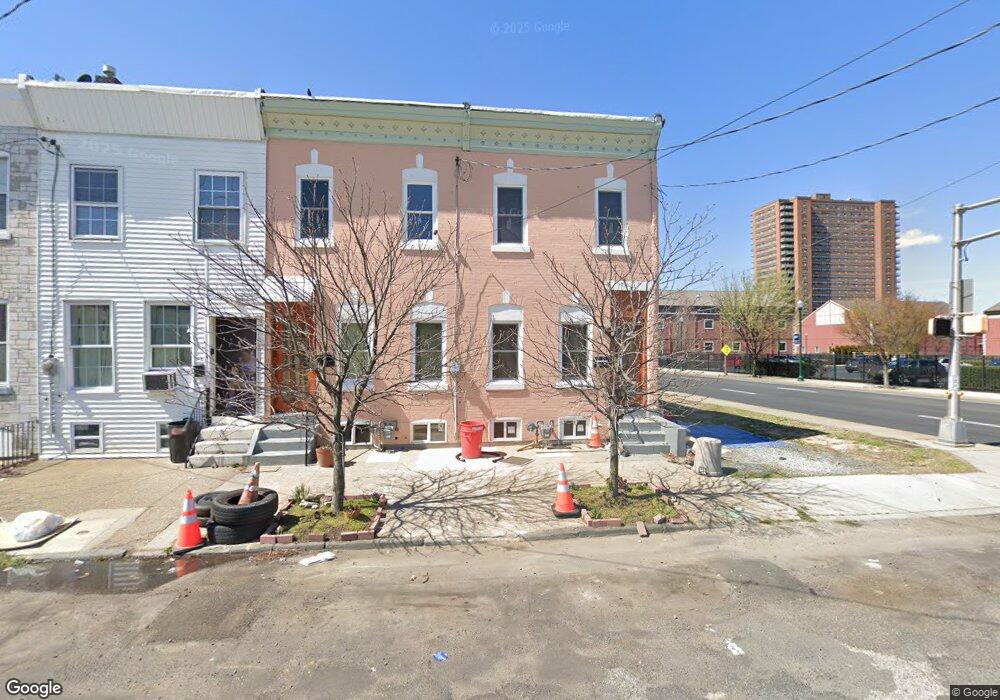
335 N 9th St Camden, NJ 08102
North Camden NeighborhoodEstimated Value: $91,000 - $180,000
--
Bed
--
Bath
1,314
Sq Ft
$104/Sq Ft
Est. Value
About This Home
This home is located at 335 N 9th St, Camden, NJ 08102 and is currently estimated at $136,297, approximately $103 per square foot. 335 N 9th St is a home located in Camden County with nearby schools including Eastside High School, Leap Academy University Charter School, and Holy Name School.
Ownership History
Date
Name
Owned For
Owner Type
Purchase Details
Closed on
Jan 30, 2023
Sold by
Sanchez Marcos K
Bought by
Placencia Domingo
Current Estimated Value
Purchase Details
Closed on
Dec 12, 2011
Sold by
Gonzalez Aracelio
Bought by
Sanchez Marco K
Purchase Details
Closed on
Aug 30, 2005
Sold by
Marrero Felipe
Bought by
Gonzalez Arcelis
Home Financials for this Owner
Home Financials are based on the most recent Mortgage that was taken out on this home.
Original Mortgage
$48,500
Interest Rate
5.78%
Create a Home Valuation Report for This Property
The Home Valuation Report is an in-depth analysis detailing your home's value as well as a comparison with similar homes in the area
Home Values in the Area
Average Home Value in this Area
Purchase History
| Date | Buyer | Sale Price | Title Company |
|---|---|---|---|
| Placencia Domingo | $8,000 | -- | |
| Sanchez Marco K | -- | -- | |
| Gonzalez Arcelis | $50,000 | -- |
Source: Public Records
Mortgage History
| Date | Status | Borrower | Loan Amount |
|---|---|---|---|
| Previous Owner | Gonzalez Arcelis | $48,500 |
Source: Public Records
Tax History Compared to Growth
Tax History
| Year | Tax Paid | Tax Assessment Tax Assessment Total Assessment is a certain percentage of the fair market value that is determined by local assessors to be the total taxable value of land and additions on the property. | Land | Improvement |
|---|---|---|---|---|
| 2025 | $1,743 | $49,200 | $5,700 | $43,500 |
| 2024 | $1,685 | $49,200 | $5,700 | $43,500 |
| 2023 | $1,685 | $49,200 | $5,700 | $43,500 |
| 2022 | $1,654 | $49,200 | $5,700 | $43,500 |
| 2021 | $1,648 | $49,200 | $5,700 | $43,500 |
| 2020 | $1,565 | $49,200 | $5,700 | $43,500 |
| 2019 | $1,498 | $49,200 | $5,700 | $43,500 |
| 2018 | $1,490 | $49,200 | $5,700 | $43,500 |
| 2017 | $1,454 | $49,200 | $5,700 | $43,500 |
| 2016 | $1,408 | $49,200 | $5,700 | $43,500 |
| 2015 | $1,355 | $49,200 | $5,700 | $43,500 |
| 2014 | $1,323 | $49,200 | $5,700 | $43,500 |
Source: Public Records
Map
Nearby Homes