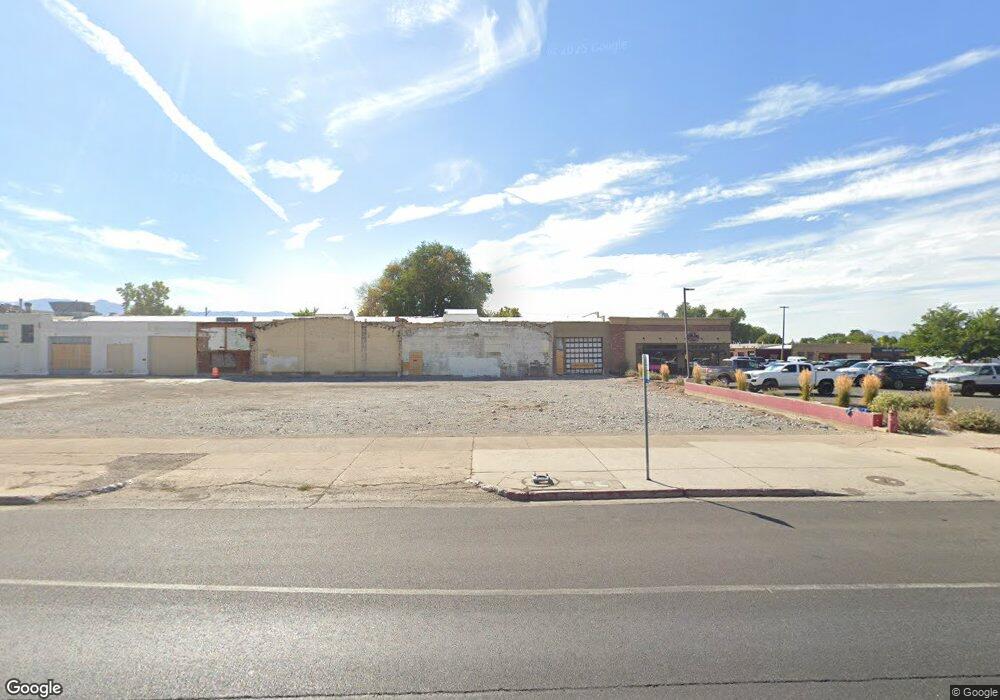
335 N Main St Logan, UT 84321
Ellis Neighborhood
Studio
--
Bath
5,980
Sq Ft
49,658
Sq Ft Lot
About This Home
This home is located at 335 N Main St, Logan, UT 84321. 335 N Main St is a home located in Cache County with nearby schools including Ellis School, Mount Logan Middle School, and Logan High School.
Ownership History
Date
Name
Owned For
Owner Type
Purchase Details
Closed on
Sep 30, 2020
Sold by
Needham Family Partnership
Bought by
City Of Logan
Purchase Details
Closed on
Jul 22, 2013
Sold by
Fluckiger H Brent and Fluckiger Ruth J
Bought by
Needham Family Partnership
Home Financials for this Owner
Home Financials are based on the most recent Mortgage that was taken out on this home.
Original Mortgage
$200,000
Interest Rate
10%
Mortgage Type
Commercial
Purchase Details
Closed on
Jun 27, 2011
Sold by
Fluckiger H Brent and Fluckiger Ruth J
Bought by
Fluckiger H Brent and Fluckiger Ruth J
Create a Home Valuation Report for This Property
The Home Valuation Report is an in-depth analysis detailing your home's value as well as a comparison with similar homes in the area
Home Values in the Area
Average Home Value in this Area
Purchase History
| Date | Buyer | Sale Price | Title Company |
|---|---|---|---|
| City Of Logan | -- | Cache Title Logan | |
| Needham Family Partnership | -- | Cache Title Logan | |
| Fluckiger H Brent | -- | None Available |
Source: Public Records
Mortgage History
| Date | Status | Borrower | Loan Amount |
|---|---|---|---|
| Previous Owner | Needham Family Partnership | $200,000 |
Source: Public Records
Tax History
| Year | Tax Paid | Tax Assessment Tax Assessment Total Assessment is a certain percentage of the fair market value that is determined by local assessors to be the total taxable value of land and additions on the property. | Land | Improvement |
|---|---|---|---|---|
| 2025 | -- | $0 | $0 | $0 |
| 2023 | $0 | $0 | $0 | $0 |
| 2022 | $0 | $0 | $0 | $0 |
| 2021 | $2,890 | $246,445 | $112,545 | $133,900 |
| 2020 | $2,890 | $246,445 | $112,545 | $133,900 |
| 2019 | $2,740 | $223,545 | $112,545 | $111,000 |
| 2018 | $3,001 | $223,545 | $112,545 | $111,000 |
| 2017 | $3,122 | $223,545 | $0 | $0 |
| 2016 | $3,237 | $212,295 | $0 | $0 |
| 2015 | $3,077 | $212,295 | $0 | $0 |
| 2014 | $2,782 | $212,295 | $0 | $0 |
| 2013 | -- | $212,295 | $0 | $0 |
Source: Public Records
Map
Nearby Homes
Your Personal Tour Guide
Ask me questions while you tour the home.