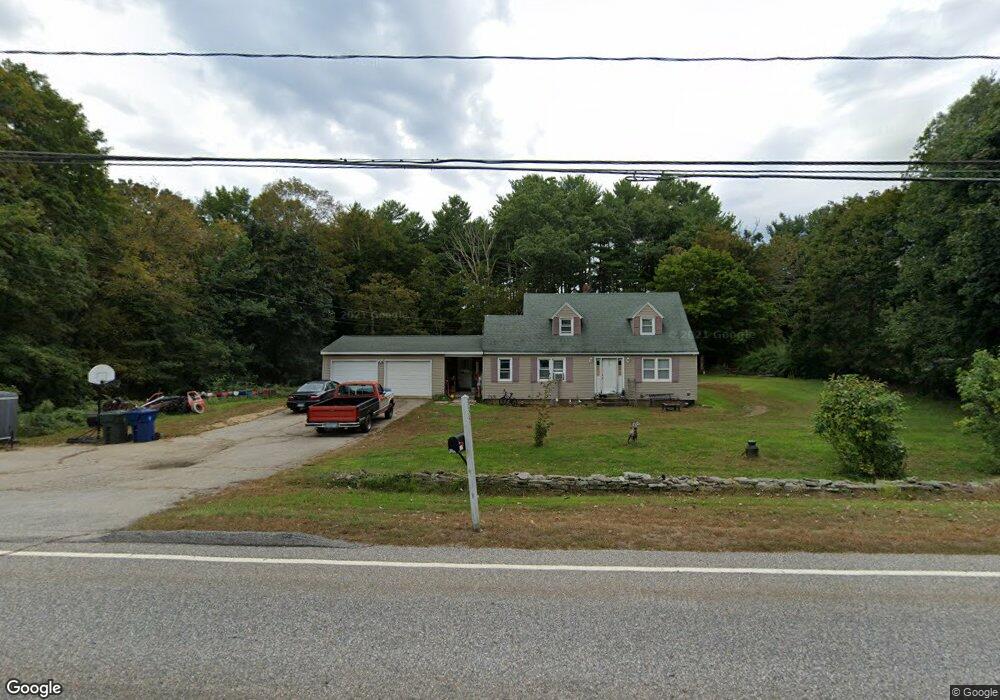
335 N Windham Rd North Windham, CT 06256
Estimated Value: $293,330 - $397,000
4
Beds
2
Baths
1,492
Sq Ft
$227/Sq Ft
Est. Value
About This Home
This home is located at 335 N Windham Rd, North Windham, CT 06256 and is currently estimated at $338,333, approximately $226 per square foot. 335 N Windham Rd is a home located in Windham County with nearby schools including North Windham School, Windham Middle School, and Windham High School.
Ownership History
Date
Name
Owned For
Owner Type
Purchase Details
Closed on
Jun 5, 2009
Sold by
Aubin Timothy
Bought by
Zeiger Ahren T and Zeiger Benjamin Rose
Current Estimated Value
Home Financials for this Owner
Home Financials are based on the most recent Mortgage that was taken out on this home.
Original Mortgage
$204,000
Outstanding Balance
$129,307
Interest Rate
4.83%
Mortgage Type
Purchase Money Mortgage
Estimated Equity
$209,026
Purchase Details
Closed on
Dec 21, 2007
Sold by
Koval Gary M
Bought by
Aubin Timothy
Purchase Details
Closed on
Jun 12, 2007
Sold by
Pledged Property 2 Llc
Bought by
Koval Gary M
Purchase Details
Closed on
Mar 24, 2000
Sold by
Campanele Francis
Bought by
Neff Susan
Home Financials for this Owner
Home Financials are based on the most recent Mortgage that was taken out on this home.
Original Mortgage
$120,920
Interest Rate
8.31%
Mortgage Type
Purchase Money Mortgage
Purchase Details
Closed on
Dec 23, 1999
Sold by
Bogda John and Bogda Paul
Bought by
Campanell Francis
Create a Home Valuation Report for This Property
The Home Valuation Report is an in-depth analysis detailing your home's value as well as a comparison with similar homes in the area
Home Values in the Area
Average Home Value in this Area
Purchase History
| Date | Buyer | Sale Price | Title Company |
|---|---|---|---|
| Zeiger Ahren T | $200,000 | -- | |
| Aubin Timothy | $105,000 | -- | |
| Koval Gary M | $80,000 | -- | |
| Neff Susan | $129,500 | -- | |
| Campanell Francis | $35,000 | -- |
Source: Public Records
Mortgage History
| Date | Status | Borrower | Loan Amount |
|---|---|---|---|
| Open | Campanell Francis | $204,000 | |
| Previous Owner | Campanell Francis | $120,920 |
Source: Public Records
Tax History
| Year | Tax Paid | Tax Assessment Tax Assessment Total Assessment is a certain percentage of the fair market value that is determined by local assessors to be the total taxable value of land and additions on the property. | Land | Improvement |
|---|---|---|---|---|
| 2025 | $4,668 | $156,370 | $29,180 | $127,190 |
| 2024 | $4,674 | $156,370 | $29,180 | $127,190 |
| 2023 | $4,306 | $110,960 | $25,370 | $85,590 |
| 2022 | $4,195 | $110,960 | $25,370 | $85,590 |
| 2021 | $4,373 | $110,960 | $25,370 | $85,590 |
| 2020 | $4,316 | $110,960 | $25,370 | $85,590 |
| 2019 | $4,261 | $110,960 | $25,370 | $85,590 |
| 2017 | $4,251 | $110,330 | $31,640 | $78,690 |
| 2015 | $3,790 | $110,330 | $31,640 | $78,690 |
| 2014 | $3,576 | $110,330 | $31,640 | $78,690 |
Source: Public Records
Map
Nearby Homes
- 6 Skyline Dr
- 96 Beacon Rd
- 248 Tuckie Rd
- 5 Woods Way Unit WOOD005
- 23 Pond Way
- 16 Pond Way
- 16 Circle Dr
- 64 Circle Dr
- 28 Circle Dr
- 55 Tuckie Rd
- 253 Brick Top Rd
- 34 N Windham Rd
- 11 Woodland Dr
- 13 Bates Rd
- 165 Ballamahack Rd
- 0 Storrs Rd Unit 2 170571015
- 15 Cracow Ave
- 615 Jackson St
- 63 Eastbrook Heights Unit E
- 40 Eastbrook Heights Unit C
- 343 N Windham Rd
- 354 N Windham Rd
- 336 N Windham Rd
- 349 N Windham Rd
- 315 N Windham Rd
- 337 N Windham Rd
- 356 N Windham Rd
- 318 N Windham Rd
- 380 N Windham Rd
- 313 N Windham Rd
- 295 N Windham Rd
- 285 N Windham Rd
- 304 N Windham Rd
- 381 N Windham Rd
- 357 N Windham Rd
- 361 N Windham Rd
- 277 N Windham Rd
- 21 Jordan Ln
- 267 N Windham Rd
- 282 N Windham Rd
Your Personal Tour Guide
Ask me questions while you tour the home.