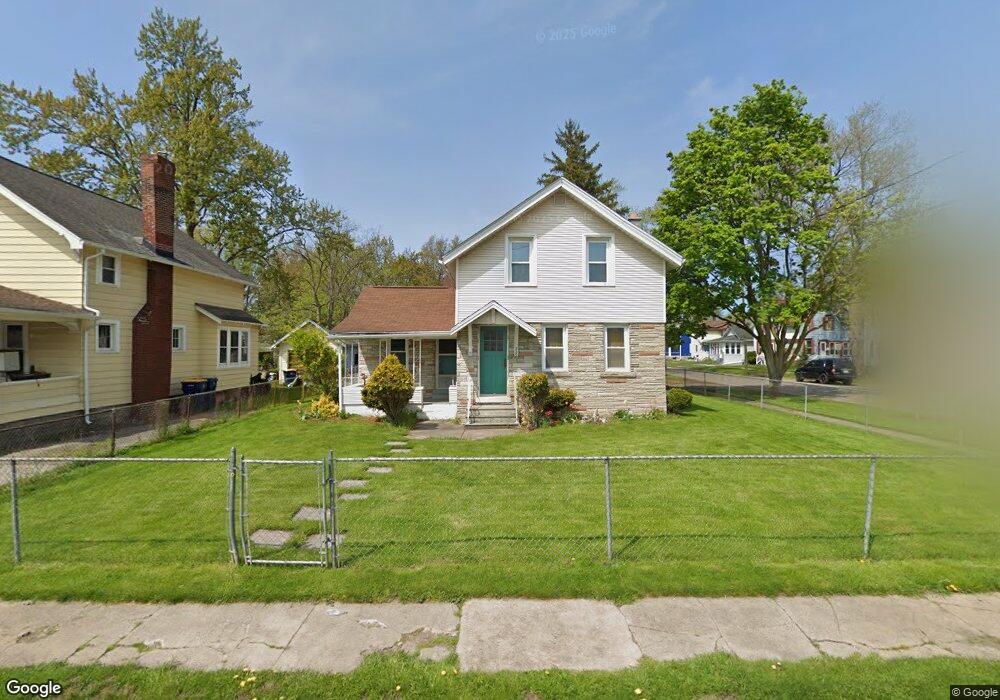
335 Prospect St Lockport, NY 14094
Estimated Value: $105,000 - $147,000
2
Beds
1
Bath
1,188
Sq Ft
$105/Sq Ft
Est. Value
About This Home
This home is located at 335 Prospect St, Lockport, NY 14094 and is currently estimated at $125,323, approximately $105 per square foot. 335 Prospect St is a home located in Niagara County with nearby schools including Aaron Mossell Junior High School, Lockport High School, and DeSales Catholic School.
Ownership History
Date
Name
Owned For
Owner Type
Purchase Details
Closed on
Oct 14, 2021
Sold by
Burkard Paul H
Bought by
Burkard Properties And Management Llc
Current Estimated Value
Purchase Details
Closed on
Mar 25, 2009
Sold by
Secretary Of The Us Department Of Housin
Bought by
Burkard Paul H
Purchase Details
Closed on
Jul 10, 2008
Sold by
Citimortgage Inc
Bought by
Sec Of Hud
Purchase Details
Closed on
Jan 11, 2008
Sold by
Henry Malvin
Bought by
Citimortgage Inc
Purchase Details
Closed on
Mar 21, 2003
Sold by
Robt W Tinklepaugh Ii Trust
Bought by
Henry Malvin
Purchase Details
Closed on
Sep 27, 2002
Sold by
Tinklepaugh Robert
Bought by
Seaman As Trustee Bonnie
Purchase Details
Closed on
Jul 10, 2002
Purchase Details
Closed on
May 14, 1999
Purchase Details
Closed on
Feb 29, 1996
Sold by
Delgrosso Roberta A
Bought by
Holloway Kelvin R
Create a Home Valuation Report for This Property
The Home Valuation Report is an in-depth analysis detailing your home's value as well as a comparison with similar homes in the area
Home Values in the Area
Average Home Value in this Area
Purchase History
| Date | Buyer | Sale Price | Title Company |
|---|---|---|---|
| Burkard Properties And Management Llc | -- | None Available | |
| Burkard Paul H | $22,330 | None Available | |
| Sec Of Hud | $63,445 | Sweeney, Gallo Etal | |
| Citimortgage Inc | $63,445 | Sweeney Gallo Etal | |
| Henry Malvin | $60,000 | Kenneth Redding | |
| Seaman As Trustee Bonnie | -- | -- | |
| Tinklepaugh Robert | $26,450 | -- | |
| -- | $56,971 | -- | |
| -- | -- | -- | |
| Holloway Kelvin R | $54,500 | -- |
Source: Public Records
Tax History
| Year | Tax Paid | Tax Assessment Tax Assessment Total Assessment is a certain percentage of the fair market value that is determined by local assessors to be the total taxable value of land and additions on the property. | Land | Improvement |
|---|---|---|---|---|
| 2024 | $2,990 | $110,000 | $4,300 | $105,700 |
| 2023 | $2,964 | $106,000 | $4,300 | $101,700 |
| 2022 | $1,929 | $96,000 | $4,300 | $91,700 |
| 2021 | $1,929 | $50,000 | $4,600 | $45,400 |
| 2020 | $1,929 | $50,000 | $4,600 | $45,400 |
| 2019 | $432 | $50,000 | $4,600 | $45,400 |
| 2018 | $1,395 | $50,000 | $4,600 | $45,400 |
| 2017 | $1,390 | $50,000 | $4,600 | $45,400 |
| 2016 | $1,346 | $50,000 | $4,600 | $45,400 |
| 2015 | -- | $50,000 | $4,600 | $45,400 |
| 2014 | -- | $50,000 | $4,600 | $45,400 |
Source: Public Records
Map
Nearby Homes
- 317 Prospect St
- 270 Grand St
- 114 Prentice St
- 370 Green St
- 258 Grand St
- 275 Ontario St
- 153 Pine St
- 235 Niagara St
- 195 Prospect St
- 147 Grand St
- 382 Ontario St
- 35 Corinthia St
- 88 Charlotte St
- 80 Charlotte St
- 59 Ontario St
- 86 Charlotte St
- 146 Prospect St
- 482 Hawley St
- VL Akron Rd
- VL Saunders Settlement Rd
Your Personal Tour Guide
Ask me questions while you tour the home.