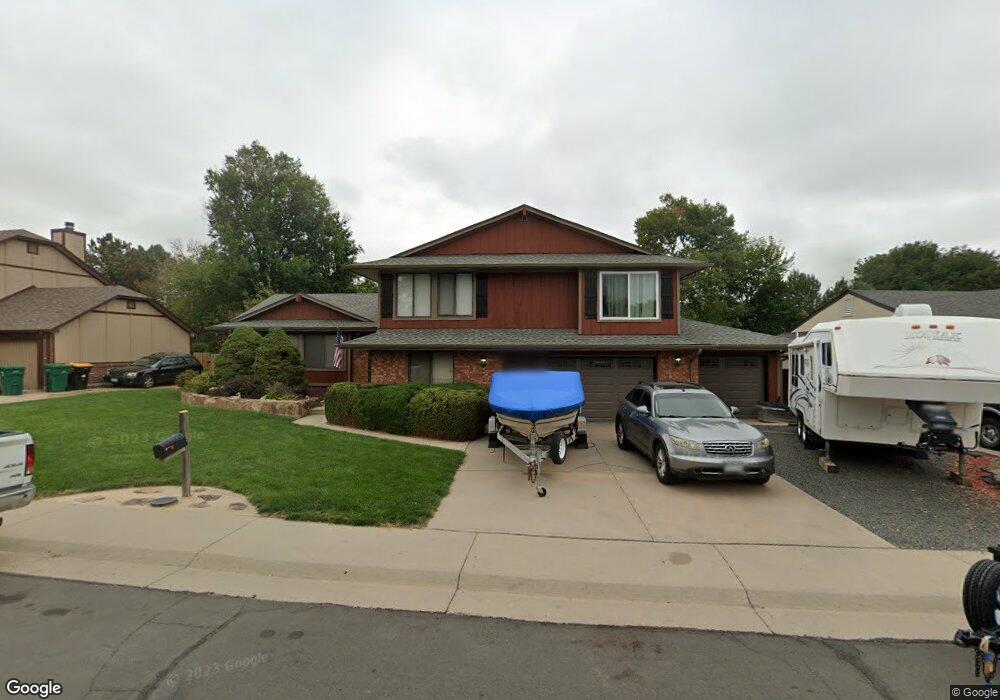
335 S 23rd Ave Brighton, CO 80601
Estimated Value: $484,000 - $565,000
4
Beds
3
Baths
3,019
Sq Ft
$173/Sq Ft
Est. Value
About This Home
This home is located at 335 S 23rd Ave, Brighton, CO 80601 and is currently estimated at $523,274, approximately $173 per square foot. 335 S 23rd Ave is a home located in Adams County with nearby schools including Southeast Elementary School, Vikan Middle School, and Brighton High School.
Ownership History
Date
Name
Owned For
Owner Type
Purchase Details
Closed on
Aug 9, 2019
Sold by
Webster Jim D and Webster Debra J
Bought by
Singleton Clinton T and Singleton Sherine M
Current Estimated Value
Home Financials for this Owner
Home Financials are based on the most recent Mortgage that was taken out on this home.
Original Mortgage
$311,250
Outstanding Balance
$270,394
Interest Rate
3.73%
Mortgage Type
New Conventional
Estimated Equity
$252,880
Purchase Details
Closed on
Dec 28, 2007
Sold by
White James and White Barbara M
Bought by
Webster Jim D and Webster Debra J
Home Financials for this Owner
Home Financials are based on the most recent Mortgage that was taken out on this home.
Original Mortgage
$212,662
Interest Rate
6.26%
Mortgage Type
FHA
Purchase Details
Closed on
Jan 23, 1998
Sold by
Mancini Lawrence E and Mancini Elaine L
Bought by
White James and White Barbara M
Create a Home Valuation Report for This Property
The Home Valuation Report is an in-depth analysis detailing your home's value as well as a comparison with similar homes in the area
Home Values in the Area
Average Home Value in this Area
Purchase History
| Date | Buyer | Sale Price | Title Company |
|---|---|---|---|
| Singleton Clinton T | $415,000 | First American Title | |
| Webster Jim D | $216,000 | Security Title | |
| White James | $186,500 | Land Title |
Source: Public Records
Mortgage History
| Date | Status | Borrower | Loan Amount |
|---|---|---|---|
| Open | Singleton Clinton T | $311,250 | |
| Previous Owner | Webster Jim D | $212,662 |
Source: Public Records
Tax History
| Year | Tax Paid | Tax Assessment Tax Assessment Total Assessment is a certain percentage of the fair market value that is determined by local assessors to be the total taxable value of land and additions on the property. | Land | Improvement |
|---|---|---|---|---|
| 2025 | $3,724 | $35,020 | $6,390 | $28,630 |
| 2024 | $3,724 | $32,190 | $5,880 | $26,310 |
| 2023 | $3,703 | $37,070 | $6,360 | $30,710 |
| 2022 | $3,037 | $27,380 | $6,530 | $20,850 |
| 2021 | $2,859 | $27,380 | $6,530 | $20,850 |
| 2020 | $2,409 | $24,110 | $6,150 | $17,960 |
| 2019 | $2,414 | $24,110 | $6,150 | $17,960 |
| 2018 | $2,138 | $21,290 | $5,760 | $15,530 |
| 2017 | $2,141 | $21,290 | $5,760 | $15,530 |
| 2016 | $1,760 | $17,410 | $3,180 | $14,230 |
| 2015 | $1,748 | $17,410 | $3,180 | $14,230 |
| 2014 | -- | $16,510 | $2,310 | $14,200 |
Source: Public Records
Map
Nearby Homes
- 548 Badger Creek Dr
- 321 S 26th Ave
- 240 S 22nd Ave
- 2587 E Egbert St
- 2618 E Egbert St
- 2608 E Egbert St
- 2617 E Egbert St
- 2522 E Egbert St
- 125 S 22nd Ave Unit 14
- 125 S 22nd Ave Unit 19
- 2262 Deer Trail Creek Dr
- 370 S 30th Ave
- 63 S 22nd Ave Unit A1-B8
- 555 S 17th Ave
- 3431 Grove St
- 628 S 16th Ave
- 2900 Purcell St Unit I-3
- 2900 Purcell St Unit J-1
- 2900 Purcell St Unit K-1
- 2900 Purcell St Unit O-4
- 334 S 22nd Avenue Ct
- 365 S 23rd Ave
- 334 S 22nd Ave
- 305 S 23rd Ave
- 364 S 22nd Ave
- 304 S 22nd Ave
- 304 S 22nd Ave
- 346 S 23rd Ave
- 326 S 23rd Ave
- 395 S 23rd Ave
- 366 S 23rd Ave
- 394 S 22nd Ave
- 306 S 23rd Ave
- 396 S 23rd Ave
- 333 S 22nd Ave
- 367 S 24th Ave
- 357 S 24th Ave
- 363 S 22nd Ave
- 2261 Skeel St
- 303 S 22nd Ave
Your Personal Tour Guide
Ask me questions while you tour the home.