335 S High St Covington, OH 45318
Covington AreaEstimated Value: $201,000 - $259,425
About This Home
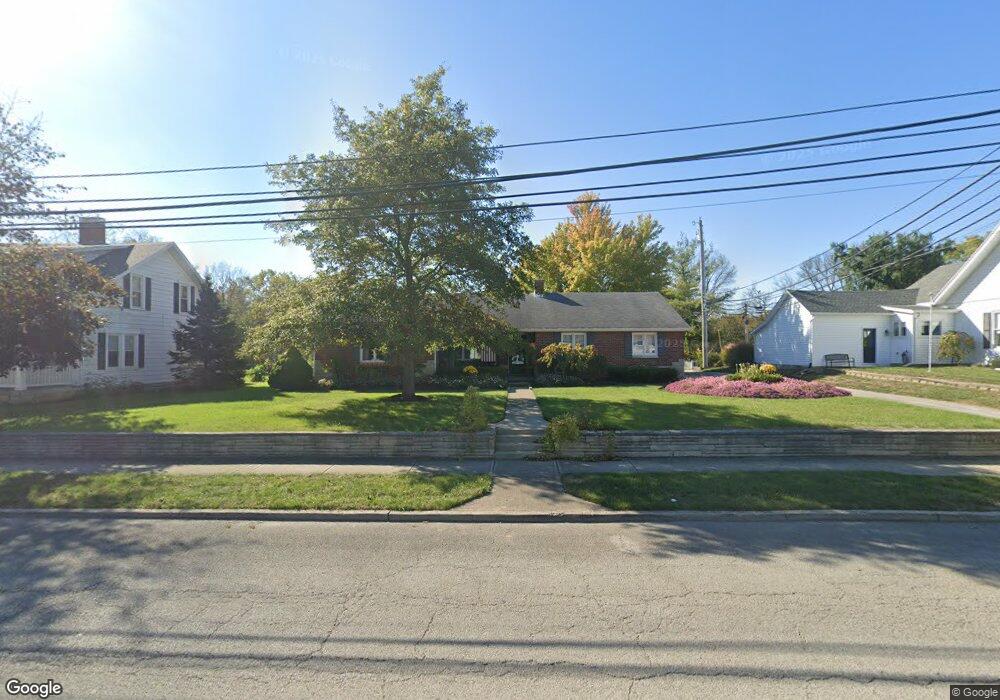
This home is located at 335 S High St, Covington, OH 45318 and is currently estimated at $234,606, approximately $144 per square foot. 335 S High St is a home located in Miami County with nearby schools including Covington Elementary/Junior High School, Covington Junior High School, and Covington High School.
Ownership History
We collect this data history from publicly available records. To have your information removed, we recommend requesting removal directly through your county’s website.
Purchase Details
Home Financials for this Owner
Home Financials are based on the most recent Mortgage that was taken out on this home.Purchase Details
Home Values in the Area
Average Home Value in this Area
Purchase History
We collect this data history from publicly available records. To have your information removed, we recommend requesting removal directly through your county’s website.
| Date | Buyer | Sale Price | Title Company |
|---|---|---|---|
| $122,000 | None Available | ||
| -- | -- |
Mortgage History
We collect this data history from publicly available records. To have your information removed, we recommend requesting removal directly through your county’s website.
| Date | Status | Borrower | Loan Amount |
|---|---|---|---|
| Open | $109,800 |
Tax History
We collect this data history from publicly available records. To have your information removed, we recommend requesting removal directly through your county’s website.
| Year | Tax Paid | Tax Assessment Tax Assessment Total Assessment is a certain percentage of the fair market value that is determined by local assessors to be the total taxable value of land and additions on the property. | Land | Improvement |
|---|---|---|---|---|
| 2025 | $2,924 | $89,570 | $12,500 | $77,070 |
| 2024 | $2,924 | $65,140 | $13,550 | $51,590 |
| 2023 | $2,440 | $65,140 | $13,550 | $51,590 |
| 2022 | $2,433 | $65,140 | $13,550 | $51,590 |
| 2021 | $2,022 | $50,120 | $10,430 | $39,690 |
| 2020 | $2,026 | $50,120 | $10,430 | $39,690 |
| 2019 | $2,035 | $50,120 | $10,430 | $39,690 |
| 2018 | $1,731 | $42,530 | $8,120 | $34,410 |
| 2017 | $1,801 | $42,530 | $8,120 | $34,410 |
| 2016 | $890 | $42,530 | $8,120 | $34,410 |
| 2015 | $1,269 | $40,890 | $7,810 | $33,080 |
| 2014 | $1,269 | $40,890 | $7,810 | $33,080 |
| 2013 | $1,222 | $40,890 | $7,810 | $33,080 |
Map
- 312 S Wall St
- 205 Charles Ct
- 210 Charles Ct
- 212 Charles Ct
- 7 S Main St
- 219 Henry Ct
- 221 Henry Ct
- 223 Henry Ct
- 224 E Walnut St
- 138 N Main St
- 254 N Wall St
- 305 Sharon St
- 698 E Broadway St
- 731 N Pearl St
- 5310 N Rangeline Rd
- 7071 W State Route 41
- 7855 N Brad Bloomer Rd
- 317 S Miami Ave
- 105 N Miami Ave
- 7855 Bradford Bloomer Rd
Ask me questions while you tour the home.