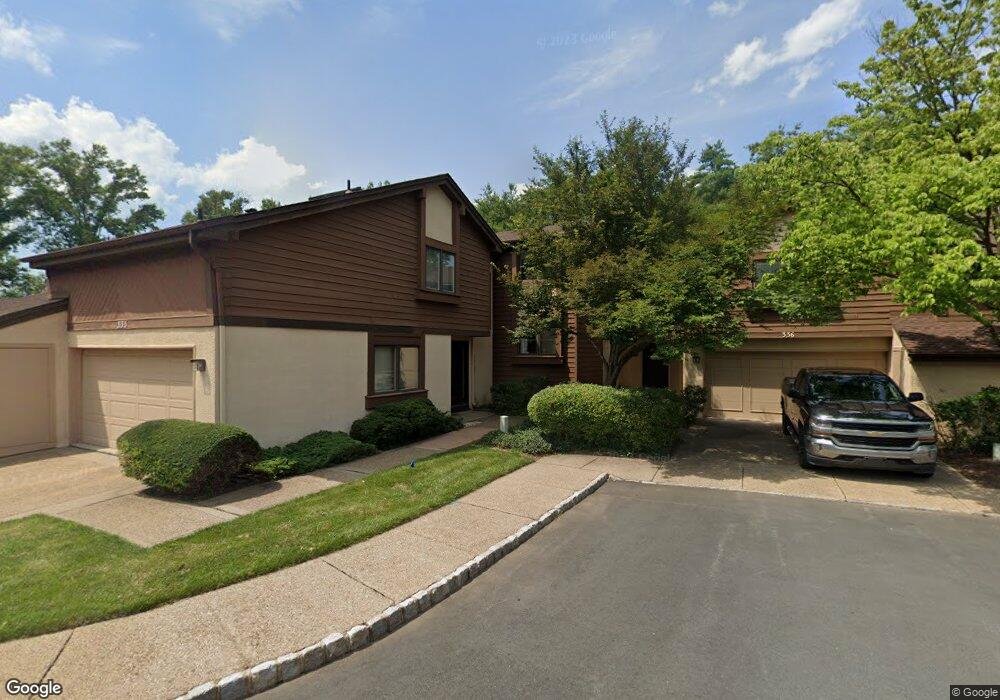
335 Sayre Dr Princeton, NJ 08540
Estimated Value: $669,000 - $735,000
--
Bed
--
Bath
1,814
Sq Ft
$387/Sq Ft
Est. Value
About This Home
This home is located at 335 Sayre Dr, Princeton, NJ 08540 and is currently estimated at $702,599, approximately $387 per square foot. 335 Sayre Dr is a home located in Middlesex County with nearby schools including Town Center Elementary School, Millstone River School, and Thomas R. Grover Middle School.
Ownership History
Date
Name
Owned For
Owner Type
Purchase Details
Closed on
Jul 24, 2000
Sold by
Bakry Khalid
Bought by
Clark Daniel and Gee Annie Kim
Current Estimated Value
Home Financials for this Owner
Home Financials are based on the most recent Mortgage that was taken out on this home.
Original Mortgage
$244,000
Outstanding Balance
$87,188
Interest Rate
8.21%
Estimated Equity
$615,411
Purchase Details
Closed on
Nov 1, 1996
Sold by
Murtha Eugene
Bought by
Bakry Khalid and Bakry Dorothy
Home Financials for this Owner
Home Financials are based on the most recent Mortgage that was taken out on this home.
Original Mortgage
$162,000
Interest Rate
7.81%
Purchase Details
Closed on
Aug 14, 1995
Sold by
Polvi Esko
Bought by
Murtha Eugene and Murtha Theresa
Home Financials for this Owner
Home Financials are based on the most recent Mortgage that was taken out on this home.
Original Mortgage
$209,000
Interest Rate
7.32%
Create a Home Valuation Report for This Property
The Home Valuation Report is an in-depth analysis detailing your home's value as well as a comparison with similar homes in the area
Home Values in the Area
Average Home Value in this Area
Purchase History
| Date | Buyer | Sale Price | Title Company |
|---|---|---|---|
| Clark Daniel | $305,000 | -- | |
| Bakry Khalid | $202,500 | -- | |
| Murtha Eugene | $223,500 | -- |
Source: Public Records
Mortgage History
| Date | Status | Borrower | Loan Amount |
|---|---|---|---|
| Open | Clark Daniel | $244,000 | |
| Previous Owner | Bakry Khalid | $162,000 | |
| Previous Owner | Murtha Eugene | $209,000 |
Source: Public Records
Tax History Compared to Growth
Tax History
| Year | Tax Paid | Tax Assessment Tax Assessment Total Assessment is a certain percentage of the fair market value that is determined by local assessors to be the total taxable value of land and additions on the property. | Land | Improvement |
|---|---|---|---|---|
| 2025 | $11,722 | $448,600 | $125,000 | $323,600 |
| 2024 | $11,439 | $448,600 | $125,000 | $323,600 |
| 2023 | $11,439 | $448,600 | $125,000 | $323,600 |
| 2022 | $11,264 | $448,600 | $125,000 | $323,600 |
| 2021 | $9,698 | $431,600 | $125,000 | $306,600 |
| 2020 | $9,917 | $414,600 | $125,000 | $289,600 |
| 2019 | $9,697 | $414,600 | $125,000 | $289,600 |
| 2018 | $9,482 | $414,600 | $125,000 | $289,600 |
| 2017 | $9,212 | $414,600 | $125,000 | $289,600 |
| 2016 | $8,806 | $414,600 | $125,000 | $289,600 |
| 2015 | $9,710 | $384,700 | $140,000 | $244,700 |
| 2014 | $9,614 | $384,700 | $140,000 | $244,700 |
Source: Public Records
Map
Nearby Homes