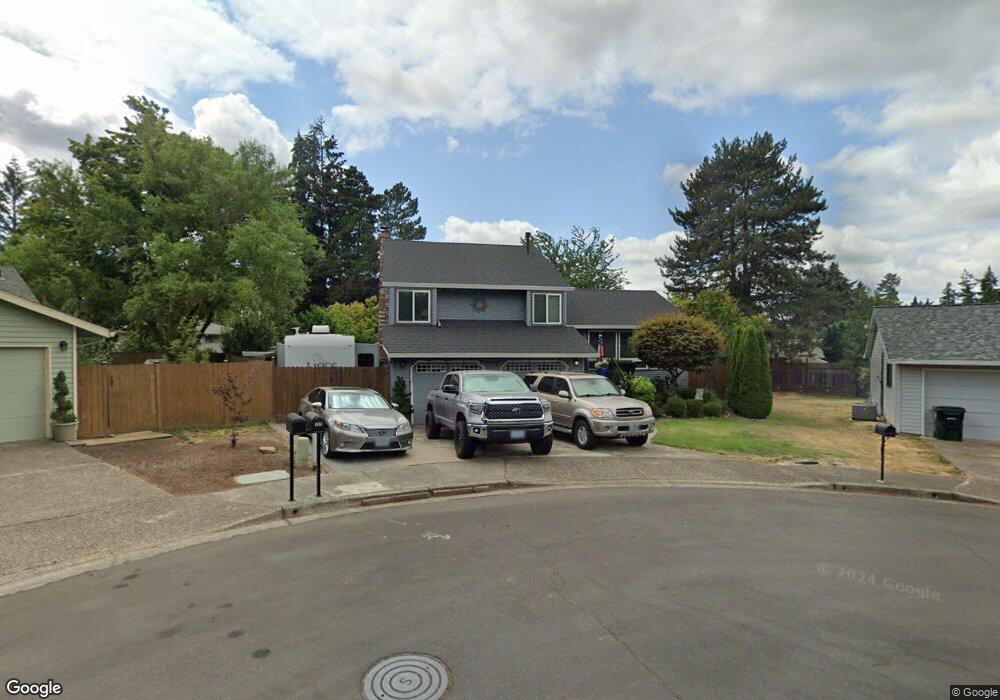
335 SW 192nd Place Beaverton, OR 97006
Estimated Value: $453,000 - $557,000
3
Beds
3
Baths
1,662
Sq Ft
$318/Sq Ft
Est. Value
About This Home
This home is located at 335 SW 192nd Place, Beaverton, OR 97006 and is currently estimated at $528,446, approximately $317 per square foot. 335 SW 192nd Place is a home located in Washington County with nearby schools including L.C. Tobias Elementary School, R.A. Brown Middle School, and Century High School.
Ownership History
Date
Name
Owned For
Owner Type
Purchase Details
Closed on
May 31, 2006
Sold by
Petersen Dana Alan
Bought by
Petersen Dana Alan and Petersen Terese Ann
Current Estimated Value
Purchase Details
Closed on
May 21, 2004
Sold by
Sweet Michael S and Pelton Sweet Laura M
Bought by
Petersen Dana A
Home Financials for this Owner
Home Financials are based on the most recent Mortgage that was taken out on this home.
Original Mortgage
$159,160
Outstanding Balance
$73,309
Interest Rate
5.25%
Mortgage Type
Unknown
Estimated Equity
$455,137
Purchase Details
Closed on
Aug 21, 2002
Sold by
Holmes James P and Holmes Billie M
Bought by
Sweet Michael S and Pelton Sweet Laura M
Home Financials for this Owner
Home Financials are based on the most recent Mortgage that was taken out on this home.
Original Mortgage
$178,386
Interest Rate
6.52%
Mortgage Type
FHA
Create a Home Valuation Report for This Property
The Home Valuation Report is an in-depth analysis detailing your home's value as well as a comparison with similar homes in the area
Home Values in the Area
Average Home Value in this Area
Purchase History
| Date | Buyer | Sale Price | Title Company |
|---|---|---|---|
| Petersen Dana Alan | -- | None Available | |
| Petersen Dana A | $198,950 | Chicago Title Insurance Comp | |
| Sweet Michael S | $181,000 | First American |
Source: Public Records
Mortgage History
| Date | Status | Borrower | Loan Amount |
|---|---|---|---|
| Open | Petersen Dana A | $159,160 | |
| Previous Owner | Sweet Michael S | $178,386 | |
| Closed | Petersen Dana A | $36,500 |
Source: Public Records
Tax History Compared to Growth
Tax History
| Year | Tax Paid | Tax Assessment Tax Assessment Total Assessment is a certain percentage of the fair market value that is determined by local assessors to be the total taxable value of land and additions on the property. | Land | Improvement |
|---|---|---|---|---|
| 2025 | $4,229 | $281,620 | -- | -- |
| 2024 | $4,110 | $273,420 | -- | -- |
| 2023 | $4,110 | $265,460 | $0 | $0 |
| 2022 | $3,949 | $265,460 | $0 | $0 |
| 2021 | $3,874 | $250,230 | $0 | $0 |
| 2020 | $3,793 | $242,950 | $0 | $0 |
| 2019 | $3,661 | $235,880 | $0 | $0 |
| 2018 | $3,502 | $229,010 | $0 | $0 |
| 2017 | $3,371 | $222,340 | $0 | $0 |
| 2016 | $3,284 | $215,870 | $0 | $0 |
| 2015 | $3,158 | $209,590 | $0 | $0 |
| 2014 | $3,135 | $203,490 | $0 | $0 |
Source: Public Records
Map
Nearby Homes
- 380 SW 194th Ct
- 19002 SW Jessica Way
- 18955 SW Boucher Ct
- 19639 SW Blackbear Ct
- 19677 SW Blackbear Ct
- 19692 SW Blackbear Ct
- 18770 SW Lisa Ct
- 680 SW Willow Creek Dr
- 312 NE 105th Ave
- 10733 NE Red Wing Way Unit 101
- 100 SW 195th Ave Unit 128
- 100 SW 195th Ave Unit 1
- 100 SW 195th Ave Unit 184
- 100 SW 195th Ave Unit 36
- 100 SW 195th Ave Unit 71
- 100 SW 195th Ave Unit 86
- 100 SW 195th Ave Unit 160
- 100 SW 195th Ave Unit 31
- 10757 NE Red Wing Way Unit 201
- 321 NE Edgeway Dr
- 360 SW 192nd Place
- 305 SW 192nd Place
- 350 SW 194th Ct
- 320 SW 194th Ct
- 290 SW 194th Ct
- 19235 SW Baseline Rd
- 19265 SW Baseline Rd
- 330 SW 192nd Place
- 300 SW 192nd Place
- 410 SW 194th Ct
- 265 SW 192nd Place
- 325 SW 194th Ct
- 355 SW 194th Ct
- 19365 SW Lisa Dr
- 19130 SW Jessica Way
- 440 SW 194th Ct
- 19162 SW Jessica Way
- 19146 SW Jessica Way
- 295 SW 194th Ct
- 385 SW 194th Ct