NOT LISTED FOR SALE

335 Thomas Ct Neenah, WI 54956

Estimated Value: $213,000 - $240,484

2 Beds
1 Bath
912 Sq Ft
$247/Sq Ft Est. Value

Last Sold August 21, 2018

Last sale price $117,000 $128 Per Sq Ft

Est. 93% increase in value since last sale

Current estimated payment $1,405/month

About This Home

As of August 2018

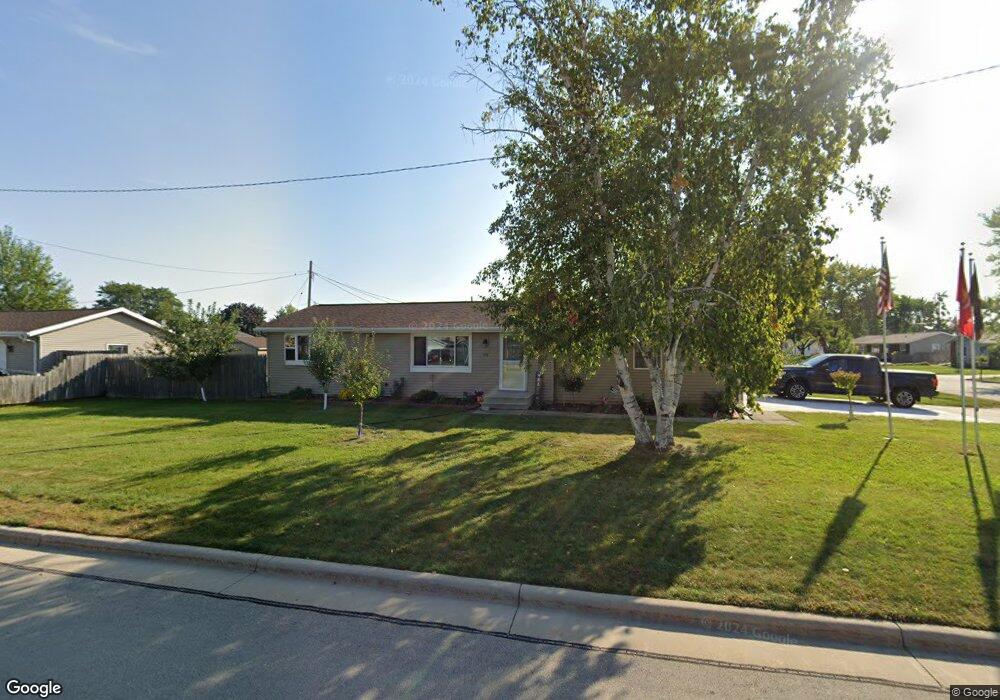
2 bedroom, 1 full bath, ranch style home with a 2 car attached garage. Freshly painted and new flooring throughout. Large kitchen with a separate dining area. Great location close to schools, shopping and amenities. This is a Fannie Mae HomePath property.

Ownership History

Date Name Owned For Owner Type

Purchase Details

Listed on
Jun 15, 2018
Closed on
Aug 2, 2018
Sold by
Fannie Mae
Bought by
Peerenboom Frank J
Seller's Agent
LISTING MAINTENANCE
RE/MAX 24/7 Real Estate, LLC
Buyer's Agent
Patty Wohlt
Berkshire Hathaway HS Water City Realty
List Price
$122,000
Sold Price
$117,000
Premium/Discount to List
-$5,000
-4.1%
Current Estimated Value
$225,621

Home Financials for this Owner

Home Financials are based on the most recent Mortgage that was taken out on this home.
Estimated Appreciation
$108,621
Avg. Annual Appreciation
9.61%
Original Mortgage
$119,515
Outstanding Balance
$103,794
Interest Rate
4.5%
Mortgage Type
VA
Estimated Equity
$121,827

Purchase Details

Closed on
Jan 19, 2018
Sold by
Ditech Financial Llc
Bought by
Federal National Mortgage Association
Source: Public Records

Range of Values:

Collateral Analytics

Collateral Analytics Collateral Analytics AVMs (Automated Valuation Model) employ a number of statistical approaches combined with neighborhood-specific comparable selection guarantees the most up-to-date and precise valuations.

Not Available

Collateral Analytics does not have data for the current month. Please view the chart for historical values.

ICE

ICE Mortgage Technology ICE Mortgage Technology’s AVM (Automated Valuation Model) is a state-of-the-art online residential property valuation tool that provides a quick and accurate estimate of the value of almost any home in the U.S.

Not Available

ICE Mortgage Technology does not have data for the current month. Please view the chart for historical values.

First American

First American First American Data & Analytics’ next-generation AVM combines unrivaled data assets with a blended ensemble of valuation models to produce highly accurate, reliable valuations you can trust.

Not Available

First American does not have data for the current month. Please view the chart for historical values.

Quantarium

Quantarium Quantarium’s valuation service, repeatedly proven the industry’s most accurate and comprehensive, is supercharged with a self-learning and auto-tuning AI engine that continually becomes smarter and more accurate as it processes daily inputs from the industry’s leading RE data lake.

Not Available

Quantarium does not have data for the current month. Please view the chart for historical values.

Average Value
Not Available
List Price
Sold Price
Create a Home Valuation Report for This Property
The Home Valuation Report is an in-depth analysis detailing your home's value as well as a comparison with similar homes in the area

Home Values in the Area

Source: Public Records

Average Home Value in this Area


Source: Public Records

Purchase History

Date Buyer Sale Price Title Company
Peerenboom Frank J -- None Available
Federal National Mortgage Association -- None Available
Source: Public Records

Mortgage History

Date Status Borrower Loan Amount
Open Peerenboom Frank J $119,515
Source: Public Records

Property History

Date Event Price List to Sale Price per Sq Ft Prior Sale
08/21/2018 08/21/18 Sold $117,000 -4.1% $128 / Sq Ft View Prior Sale
07/16/2018 07/16/18 Pending -- -- --
06/15/2018 06/15/18 For Sale $122,000 -- $134 / Sq Ft

Tax History Compared to Growth

Source: Public Records

Tax History

Year Tax Paid Tax Assessment Tax Assessment Total Assessment is a certain percentage of the fair market value that is determined by local assessors to be the total taxable value of land and additions on the property. Land Improvement
2024 $2,513 $171,000 $31,500 $139,500
2023 $2,513 $171,000 $31,500 $139,500
2022 $2,412 $125,000 $26,500 $98,500
2021 $2,446 $125,000 $26,500 $98,500
2020 $2,518 $125,000 $26,500 $98,500
2019 $2,355 $125,000 $26,500 $98,500
2018 $2,009 $92,000 $23,000 $69,000
2017 $2,568 $92,000 $23,000 $69,000
2016 $2,887 $92,000 $23,000 $69,000
2015 $2,793 $92,000 $23,000 $69,000
2014 $2,777 $92,000 $23,000 $69,000
2013 $2,858 $92,000 $23,000 $69,000
Source: Public Records

Agents Affiliated with this Home

  • Section Image
See All Agents

Map