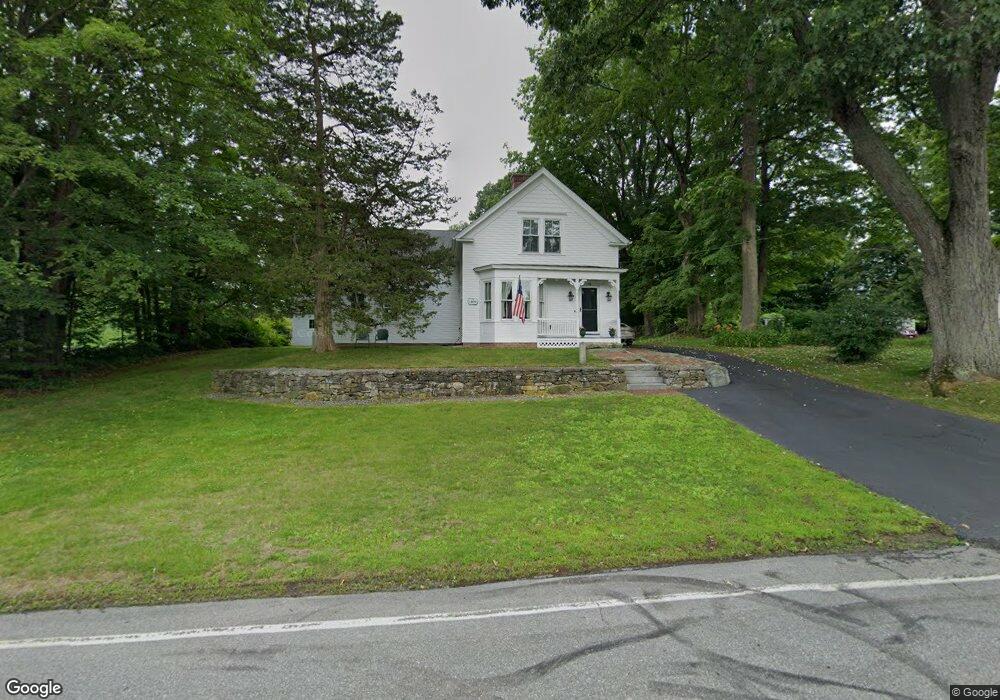
335 W Main St Millbury, MA 01527
Estimated Value: $484,856 - $611,000
2
Beds
3
Baths
1,727
Sq Ft
$320/Sq Ft
Est. Value
About This Home
This home is located at 335 W Main St, Millbury, MA 01527 and is currently estimated at $553,214, approximately $320 per square foot. 335 W Main St is a home located in Worcester County with nearby schools including Elmwood Street Elementary School, Raymond E. Shaw Elementary School, and Millbury Junior/Senior High School.
Ownership History
Date
Name
Owned For
Owner Type
Purchase Details
Closed on
Jan 4, 2024
Sold by
Brady Suzanne M
Bought by
Suzanne M Brady Ret and Brady
Current Estimated Value
Purchase Details
Closed on
Nov 24, 2003
Sold by
B & P Prop Llc
Bought by
Brady Suzanne M
Home Financials for this Owner
Home Financials are based on the most recent Mortgage that was taken out on this home.
Original Mortgage
$158,500
Interest Rate
5.98%
Mortgage Type
Purchase Money Mortgage
Purchase Details
Closed on
Jun 13, 2003
Sold by
Roach Laurie Ann
Bought by
B & P Properties Llc
Create a Home Valuation Report for This Property
The Home Valuation Report is an in-depth analysis detailing your home's value as well as a comparison with similar homes in the area
Home Values in the Area
Average Home Value in this Area
Purchase History
| Date | Buyer | Sale Price | Title Company |
|---|---|---|---|
| Suzanne M Brady Ret | -- | None Available | |
| Suzanne M Brady Ret | -- | None Available | |
| Brady Suzanne M | $200,201 | -- | |
| Brady Suzanne M | $200,201 | -- | |
| B & P Properties Llc | $172,000 | -- | |
| B & P Properties Llc | $172,000 | -- |
Source: Public Records
Mortgage History
| Date | Status | Borrower | Loan Amount |
|---|---|---|---|
| Previous Owner | B & P Properties Llc | $131,300 | |
| Previous Owner | B & P Properties Llc | $150,200 | |
| Previous Owner | Brady Suzanne M | $158,500 |
Source: Public Records
Tax History Compared to Growth
Tax History
| Year | Tax Paid | Tax Assessment Tax Assessment Total Assessment is a certain percentage of the fair market value that is determined by local assessors to be the total taxable value of land and additions on the property. | Land | Improvement |
|---|---|---|---|---|
| 2025 | $5,511 | $411,600 | $119,100 | $292,500 |
| 2024 | $5,067 | $383,000 | $110,300 | $272,700 |
| 2023 | $4,605 | $318,700 | $77,400 | $241,300 |
| 2022 | $4,400 | $293,300 | $77,400 | $215,900 |
| 2021 | $4,394 | $284,800 | $77,400 | $207,400 |
| 2020 | $5,937 | $272,800 | $77,400 | $195,400 |
| 2019 | $4,522 | $285,300 | $77,000 | $208,300 |
| 2018 | $7,925 | $248,800 | $77,000 | $171,800 |
| 2017 | $3,818 | $232,400 | $77,000 | $155,400 |
| 2016 | $3,671 | $223,000 | $77,000 | $146,000 |
| 2015 | $3,583 | $217,700 | $78,300 | $139,400 |
| 2014 | $3,388 | $198,100 | $81,800 | $116,300 |
Source: Public Records
Map
Nearby Homes