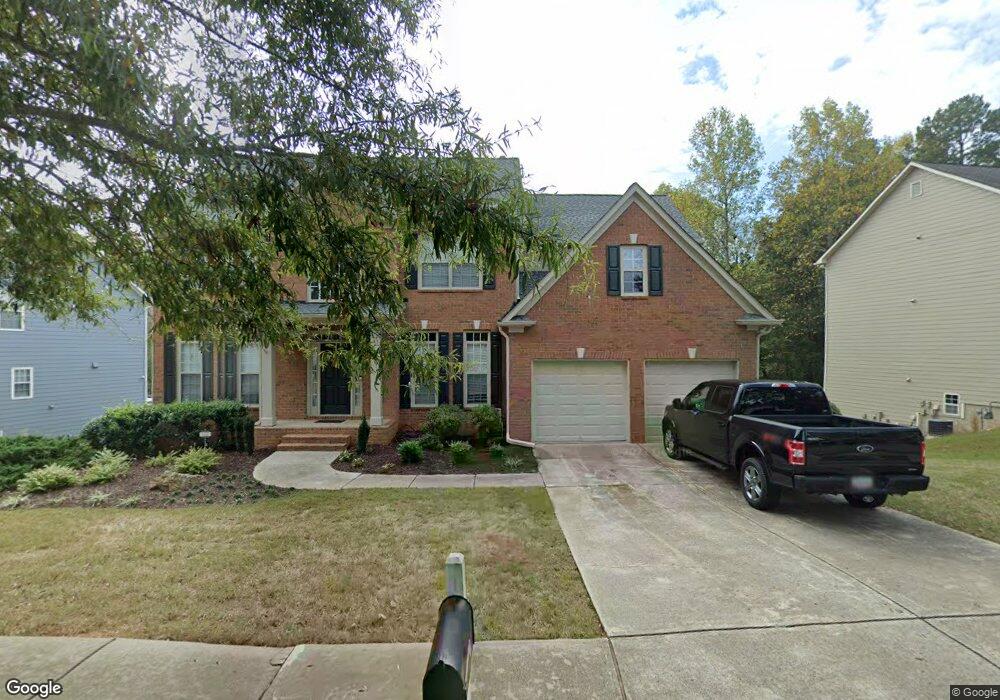
335 Windsong Way Woodstock, GA 30188
Estimated Value: $673,000 - $724,328
5
Beds
4
Baths
3,906
Sq Ft
$179/Sq Ft
Est. Value
About This Home
This home is located at 335 Windsong Way, Woodstock, GA 30188 and is currently estimated at $698,664, approximately $178 per square foot. 335 Windsong Way is a home located in Cherokee County with nearby schools including Woodstock Elementary School, Woodstock Middle School, and Woodstock High School.
Ownership History
Date
Name
Owned For
Owner Type
Purchase Details
Closed on
Jul 21, 2006
Sold by
West Yong S and West Young A
Bought by
Lamar Charles L and Lamar Tosh
Current Estimated Value
Home Financials for this Owner
Home Financials are based on the most recent Mortgage that was taken out on this home.
Original Mortgage
$230,000
Outstanding Balance
$136,997
Interest Rate
6.71%
Mortgage Type
New Conventional
Estimated Equity
$561,667
Purchase Details
Closed on
Feb 5, 2004
Sold by
Patel Bharatkmar L and Patel Daxaben B
Bought by
West Yong S
Home Financials for this Owner
Home Financials are based on the most recent Mortgage that was taken out on this home.
Original Mortgage
$232,560
Interest Rate
5.77%
Mortgage Type
New Conventional
Purchase Details
Closed on
Aug 13, 2001
Sold by
Mccar Development Corp
Bought by
Patel Bharatkumar L
Home Financials for this Owner
Home Financials are based on the most recent Mortgage that was taken out on this home.
Original Mortgage
$192,100
Interest Rate
6.89%
Mortgage Type
New Conventional
Create a Home Valuation Report for This Property
The Home Valuation Report is an in-depth analysis detailing your home's value as well as a comparison with similar homes in the area
Home Values in the Area
Average Home Value in this Area
Purchase History
| Date | Buyer | Sale Price | Title Company |
|---|---|---|---|
| Lamar Charles L | $287,500 | -- | |
| West Yong S | $244,800 | -- | |
| Patel Bharatkumar L | $240,200 | -- |
Source: Public Records
Mortgage History
| Date | Status | Borrower | Loan Amount |
|---|---|---|---|
| Open | Lamar Charles L | $230,000 | |
| Previous Owner | West Yong S | $232,560 | |
| Previous Owner | Patel Bharatkumar L | $192,100 |
Source: Public Records
Tax History Compared to Growth
Tax History
| Year | Tax Paid | Tax Assessment Tax Assessment Total Assessment is a certain percentage of the fair market value that is determined by local assessors to be the total taxable value of land and additions on the property. | Land | Improvement |
|---|---|---|---|---|
| 2024 | $5,361 | $238,196 | $44,800 | $193,396 |
| 2023 | $503 | $240,680 | $44,800 | $195,880 |
| 2022 | $4,822 | $202,040 | $40,000 | $162,040 |
| 2021 | $4,260 | $189,280 | $32,000 | $157,280 |
| 2020 | $4,939 | $174,440 | $22,000 | $152,440 |
| 2019 | $3,688 | $160,520 | $22,000 | $138,520 |
| 2018 | $3,312 | $140,760 | $22,000 | $118,760 |
| 2017 | $3,210 | $336,300 | $22,000 | $112,520 |
| 2016 | $2,982 | $305,100 | $20,000 | $102,040 |
| 2015 | $2,814 | $281,100 | $20,000 | $92,440 |
| 2014 | $2,614 | $257,600 | $20,000 | $83,040 |
Source: Public Records
Map
Nearby Homes
- The Barrington Plan at South on Main
- 9244 Main St Unit 102
- 1100 Thomas St
- 1104 Thomas St
- 967 S On Main Dr
- 963 S On Main Dr
- 202 Dawson Dr
- 191 Fowler St
- 200 Dawson Dr
- 170 Fowler St Unit 100
- 170 Fowler St Unit 200
- 108 Barnesdale Terrace
- 308 Chardonnay Way
- 219 Dawson Dr
- 110 Barnesdale Terrace
- 147 Hubbard Rd
- 228 Dawson Dr
- 304 Winchester Way
- 333 Windsong Way
- 337 Windsong Way
- 331 Windsong Way
- 225 Morning Mist Ln
- 227 Morning Mist Ln
- 339 Windsong Way
- 324 Windstong Way
- 324 Windsong Way
- 326 Windsong Way
- 223 Morning Mist Ln
- 701 Song Bird Way
- 322 Windsong Way
- 328 Windsong Way
- 221 Morning Mist Ln
- 116 Serenade Ln
- 228 Morning Mist Ln
- 703 Songbird Way
- 114 Serenade Ln
- 418 Windsong Way
- 700 Song Bird Way