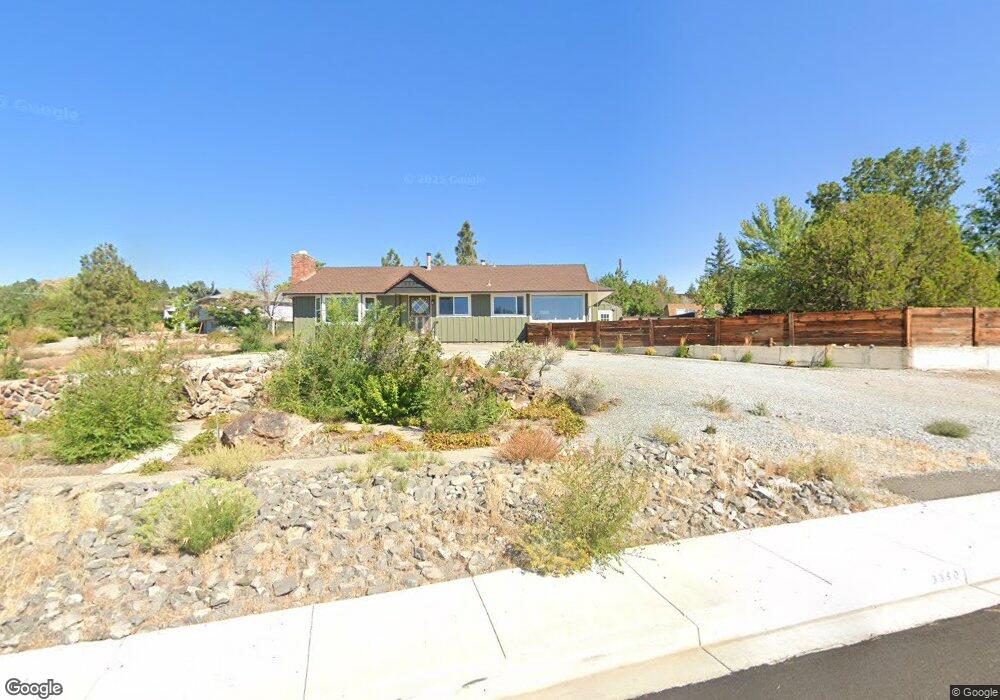
3350 Comstock Dr Reno, NV 89512
West University NeighborhoodEstimated Value: $389,000 - $620,000
4
Beds
2
Baths
1,633
Sq Ft
$299/Sq Ft
Est. Value
About This Home
This home is located at 3350 Comstock Dr, Reno, NV 89512 and is currently estimated at $488,034, approximately $298 per square foot. 3350 Comstock Dr is a home located in Washoe County with nearby schools including Peavine Elementary School, Archie Clayton Pre-AP Academy, and Coral Academy Charter School Elementary.
Ownership History
Date
Name
Owned For
Owner Type
Purchase Details
Closed on
Sep 24, 2025
Sold by
Helgerson John O
Bought by
Helgerson Family Trust and Helgerson
Current Estimated Value
Purchase Details
Closed on
Aug 10, 2021
Sold by
Gill West
Bought by
Helgerson John O and Peterson Kelly M
Home Financials for this Owner
Home Financials are based on the most recent Mortgage that was taken out on this home.
Original Mortgage
$299,250
Interest Rate
2.9%
Mortgage Type
New Conventional
Purchase Details
Closed on
Feb 13, 2015
Sold by
Waltenspiel George Weston and Waltenspiel Elizabeth Alice Zang
Bought by
Gill West
Home Financials for this Owner
Home Financials are based on the most recent Mortgage that was taken out on this home.
Original Mortgage
$160,000
Interest Rate
3.8%
Mortgage Type
Unknown
Purchase Details
Closed on
Mar 7, 2002
Sold by
Waltenspiel George Weston and Waltenspiel Elizabeth Alice Zang
Bought by
Waltenspiel George Weston and Waltenspiel Elizabeth Alice Zang
Create a Home Valuation Report for This Property
The Home Valuation Report is an in-depth analysis detailing your home's value as well as a comparison with similar homes in the area
Home Values in the Area
Average Home Value in this Area
Purchase History
| Date | Buyer | Sale Price | Title Company |
|---|---|---|---|
| Helgerson Family Trust | -- | None Listed On Document | |
| Helgerson John O | $315,000 | Stewart Title Company | |
| Gill West | $160,000 | Capital Title Co Of Nevada | |
| Waltenspiel George Weston | $81,330 | -- |
Source: Public Records
Mortgage History
| Date | Status | Borrower | Loan Amount |
|---|---|---|---|
| Previous Owner | Helgerson John O | $299,250 | |
| Previous Owner | Gill West | $160,000 |
Source: Public Records
Tax History
| Year | Tax Paid | Tax Assessment Tax Assessment Total Assessment is a certain percentage of the fair market value that is determined by local assessors to be the total taxable value of land and additions on the property. | Land | Improvement |
|---|---|---|---|---|
| 2026 | $962 | $80,980 | $54,600 | $26,380 |
| 2025 | $1,253 | $80,815 | $54,600 | $26,215 |
| 2024 | $1,215 | $77,318 | $51,450 | $25,868 |
| 2023 | $1,215 | $75,336 | $51,450 | $23,886 |
| 2022 | $1,180 | $70,178 | $50,715 | $19,464 |
| 2021 | $1,146 | $56,827 | $37,835 | $18,992 |
| 2020 | $1,076 | $56,456 | $37,835 | $18,621 |
| 2019 | $1,026 | $54,302 | $36,628 | $17,674 |
| 2018 | $966 | $46,754 | $30,188 | $16,566 |
| 2017 | $927 | $36,755 | $20,125 | $16,630 |
| 2016 | $904 | $33,738 | $17,220 | $16,518 |
| 2015 | $903 | $29,961 | $13,685 | $16,276 |
| 2014 | $904 | $28,013 | $12,600 | $15,413 |
| 2013 | -- | $23,036 | $8,190 | $14,846 |
Source: Public Records
Map
Nearby Homes
- 3400 Socrates Dr
- 3558 Penn National Dr
- 3566 Penn National Dr
- 3622 Ruidoso St
- 200 Talus Way Unit 232
- 200 Talus Way Unit 434
- 3656 Ruidoso St
- 140 Griswold Way Unit C
- 3501 Gypsum Rd
- 230 Bisset Ct Unit B
- 3696 Shale Ct
- 3545 Buckhorn Way
- 4076 Anthony James Ct
- 33 Colombard Way
- 4179 Amber Marie Ln
- 26 S Chardonnay St
- 147 Vista Rafael Pkwy
- 103 Vista Rafael Pkwy
- 63 Vista Rafael Pkwy
- 41 Vista Rafael Pkwy
- 3380 Comstock Dr
- 650 Greenstone Dr
- 3345 Socrates Dr
- 3325 Socrates Dr
- 600 Greenstone Dr
- 585 Greenstone
- 3375 Comstock Dr
- 590 Greenstone Dr
- 3386 Comstock Dr
- 720 Icarus Ct
- 25 Greenstone Dr
- 750 Icarus Ct
- 3285 Socrates Dr
- 3220 Comstock Dr
- 3390 Comstock Dr
- 570 Greenstone Dr
- 3350 Socrates Dr
- 565 Greenstone Dr
- 735 Icarus Ct
- 3320 Socrates Dr
Your Personal Tour Guide
Ask me questions while you tour the home.