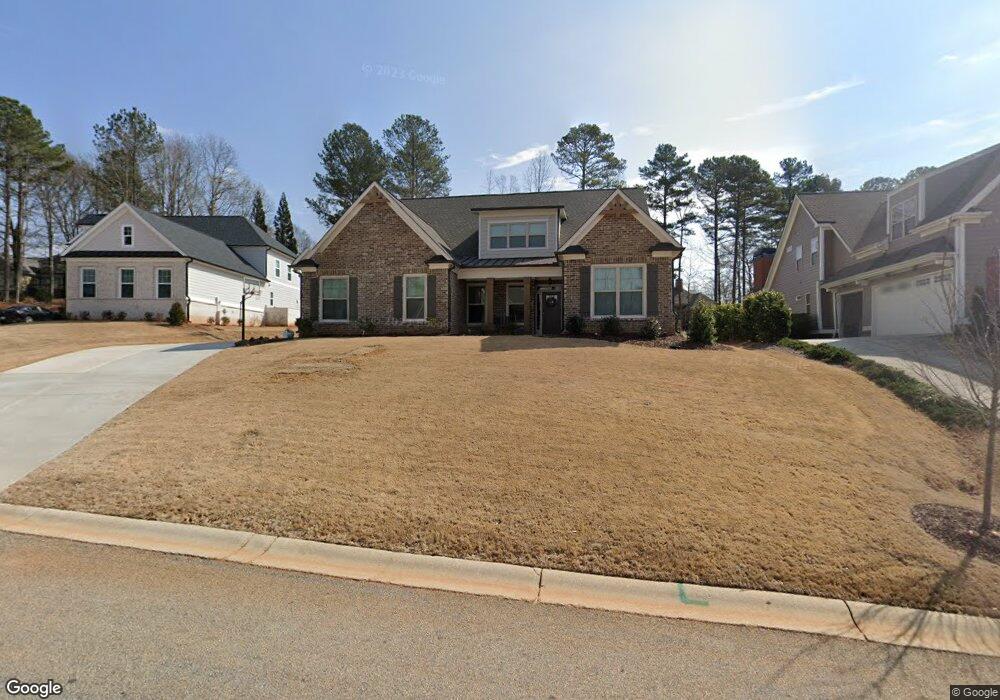
3350 Shady Creek Ct Unit E-27 Jefferson, GA 30549
Estimated Value: $649,000 - $737,000
--
Bed
1
Bath
3,075
Sq Ft
$224/Sq Ft
Est. Value
About This Home
This home is located at 3350 Shady Creek Ct Unit E-27, Jefferson, GA 30549 and is currently estimated at $688,758, approximately $223 per square foot. 3350 Shady Creek Ct Unit E-27 is a home located in Jackson County with nearby schools including Gum Springs Elementary School, West Jackson Middle School, and Jackson County High School.
Ownership History
Date
Name
Owned For
Owner Type
Purchase Details
Closed on
Jul 29, 2021
Sold by
Mb Endeavors Llc
Bought by
Smitih Brandon M and Smith Maryann P
Current Estimated Value
Purchase Details
Closed on
Sep 12, 2019
Sold by
Kot Irina
Bought by
Mb Endeavors Llc
Home Financials for this Owner
Home Financials are based on the most recent Mortgage that was taken out on this home.
Original Mortgage
$31,500
Interest Rate
3.6%
Mortgage Type
New Conventional
Purchase Details
Closed on
Mar 31, 2017
Sold by
Mcelroy Jeremy Alan
Bought by
Kot Irina
Purchase Details
Closed on
May 6, 2004
Sold by
Bluegreen Communities
Bought by
Mcelroy Jeremy Alan
Create a Home Valuation Report for This Property
The Home Valuation Report is an in-depth analysis detailing your home's value as well as a comparison with similar homes in the area
Home Values in the Area
Average Home Value in this Area
Purchase History
| Date | Buyer | Sale Price | Title Company |
|---|---|---|---|
| Smitih Brandon M | $495,900 | -- | |
| Mb Endeavors Llc | $45,000 | -- | |
| Kot Irina | $36,000 | -- | |
| Mcelroy Jeremy Alan | $66,900 | -- |
Source: Public Records
Mortgage History
| Date | Status | Borrower | Loan Amount |
|---|---|---|---|
| Previous Owner | Mb Endeavors Llc | $31,500 |
Source: Public Records
Tax History Compared to Growth
Tax History
| Year | Tax Paid | Tax Assessment Tax Assessment Total Assessment is a certain percentage of the fair market value that is determined by local assessors to be the total taxable value of land and additions on the property. | Land | Improvement |
|---|---|---|---|---|
| 2024 | $7,529 | $292,320 | $36,000 | $256,320 |
| 2023 | $7,529 | $259,280 | $36,000 | $223,280 |
| 2022 | $5,715 | $204,160 | $32,400 | $171,760 |
| 2021 | $422 | $14,400 | $14,400 | $0 |
| 2020 | $461 | $14,400 | $14,400 | $0 |
| 2019 | $468 | $14,400 | $14,400 | $0 |
| 2018 | $474 | $14,400 | $14,400 | $0 |
| 2017 | $478 | $14,400 | $14,400 | $0 |
| 2016 | $868 | $26,000 | $26,000 | $0 |
| 2015 | $200 | $6,000 | $6,000 | $0 |
| 2014 | $200 | $6,000 | $6,000 | $0 |
| 2013 | -- | $4,000 | $4,000 | $0 |
Source: Public Records
Map
Nearby Homes
- 3028 Mulberry Greens Ln
- The Wynward Plan at Traditions of Braselton
- The Grayson Plan at Traditions of Braselton
- The Brookmont Plan at Traditions of Braselton
- The Rosewood Plan at Traditions of Braselton
- 3330 Shady Creek Ct
- 3040 Mulberry Greens Ln
- 4016 Links Blvd
- 4022 Links Blvd
- 4028 Links Blvd
- 4040 Links Blvd
- 4380 Links Blvd
- 4045 Links Blvd
- 4057 Links Blvd
- 2227 Cotton Gin Row
- 4341 Links Blvd
- 2372 Cotton Gin Row
- 3173 Mulberry Greens Ln
- 3111 Mulberry Greens Ln
- 3350 Shady Creek Ct
- 3350 Shady Creek Ct Unit 27E
- 3360 Shady Creek Ct
- 3360 Shady Creek Ct Unit 28
- 3340 Shady Creek Ct
- 3370 Shady Creek Ct
- 3370 Shady Creek Ct Unit 29E
- 3028 Mulberry Greens Ln Unit 19
- E 33 Shady Creek Ct
- Lot 36 Shady Creek Ct
- 3024 Mulberry Greens Ln
- 3032 Mulberry Greens Ln
- 3361 Shady Creek Ct
- 3351 Shady Creek Ct
- 3380 Shady Creek Ct
- 3341 Shady Creek Ct
- 3341 Shady Creek Ct Unit 36E
- 3381 Shady Creek Ct
- 3320 Shady Creek Ct
- 3320 Shady Creek Ct Unit 24E