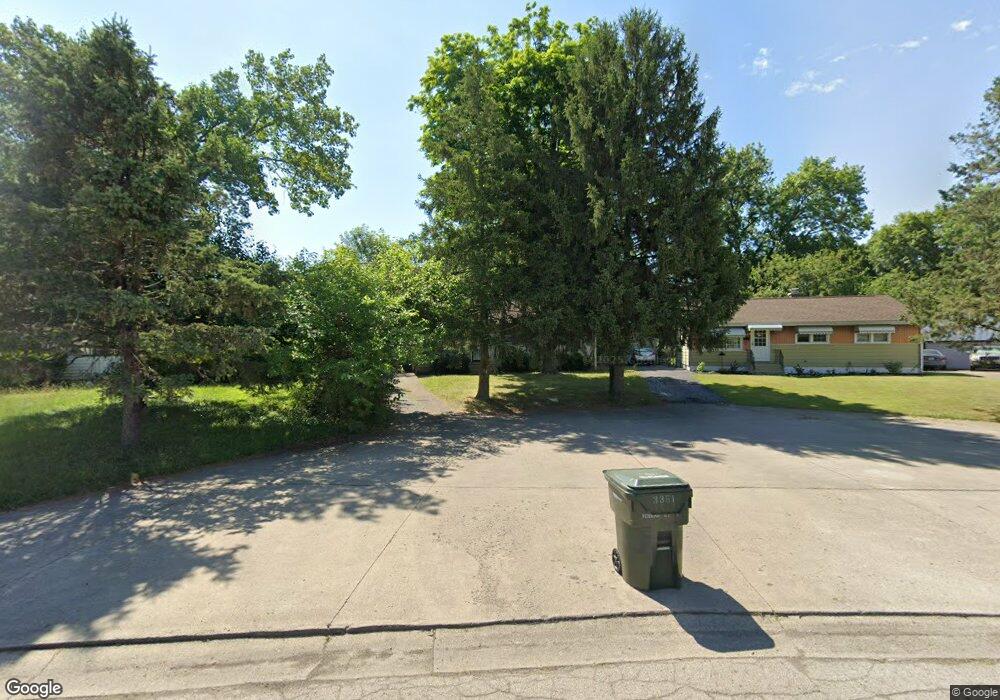
3351 Towers Ct S Columbus, OH 43227
Eastmoor NeighborhoodEstimated Value: $181,101 - $230,000
3
Beds
1
Bath
900
Sq Ft
$220/Sq Ft
Est. Value
About This Home
This home is located at 3351 Towers Ct S, Columbus, OH 43227 and is currently estimated at $198,025, approximately $220 per square foot. 3351 Towers Ct S is a home located in Franklin County with nearby schools including Scottwood Elementary School, Johnson Park Middle School, and Walnut Ridge High School.
Ownership History
Date
Name
Owned For
Owner Type
Purchase Details
Closed on
Jan 14, 2020
Sold by
Estate Of Belicia Mane Simon
Bought by
Edgington Shakira Simon and Simon Candice
Current Estimated Value
Purchase Details
Closed on
Nov 14, 2003
Sold by
Woodford Carl H and Woodford Diedre
Bought by
Simon Belicia M
Home Financials for this Owner
Home Financials are based on the most recent Mortgage that was taken out on this home.
Original Mortgage
$91,900
Outstanding Balance
$42,635
Interest Rate
6.01%
Mortgage Type
Purchase Money Mortgage
Estimated Equity
$155,390
Purchase Details
Closed on
Apr 16, 2003
Sold by
Douglas Sherry R and Beneficial Ohio Inc
Bought by
Woodford Carl H
Purchase Details
Closed on
May 31, 1994
Bought by
Douglas Sherry R
Purchase Details
Closed on
Jun 26, 1991
Create a Home Valuation Report for This Property
The Home Valuation Report is an in-depth analysis detailing your home's value as well as a comparison with similar homes in the area
Home Values in the Area
Average Home Value in this Area
Purchase History
| Date | Buyer | Sale Price | Title Company |
|---|---|---|---|
| Edgington Shakira Simon | -- | None Available | |
| Simon Belicia M | $94,900 | -- | |
| Woodford Carl H | $68,600 | -- | |
| Douglas Sherry R | $66,900 | -- | |
| -- | $58,900 | -- |
Source: Public Records
Mortgage History
| Date | Status | Borrower | Loan Amount |
|---|---|---|---|
| Open | Simon Belicia M | $91,900 |
Source: Public Records
Tax History Compared to Growth
Tax History
| Year | Tax Paid | Tax Assessment Tax Assessment Total Assessment is a certain percentage of the fair market value that is determined by local assessors to be the total taxable value of land and additions on the property. | Land | Improvement |
|---|---|---|---|---|
| 2024 | $2,551 | $56,840 | $13,300 | $43,540 |
| 2023 | $2,518 | $56,840 | $13,300 | $43,540 |
| 2022 | $1,527 | $29,440 | $6,720 | $22,720 |
| 2021 | $1,530 | $29,440 | $6,720 | $22,720 |
| 2020 | $1,532 | $29,440 | $6,720 | $22,720 |
| 2019 | $943 | $24,290 | $5,600 | $18,690 |
| 2018 | $921 | $24,290 | $5,600 | $18,690 |
| 2017 | $942 | $24,290 | $5,600 | $18,690 |
| 2016 | $992 | $23,730 | $4,760 | $18,970 |
| 2015 | $1,164 | $23,730 | $4,760 | $18,970 |
| 2014 | $1,430 | $23,730 | $4,760 | $18,970 |
| 2013 | $784 | $26,355 | $5,285 | $21,070 |
Source: Public Records
Map
Nearby Homes
- 3339 Towers Ct N
- 3325 Towers Ct S
- 892 Ruby Ave
- 3563 Astor Ave
- 891 S Weyant Ave Unit 893
- 1054 S Hampton Rd
- 864 S Waverly St
- 3598 Astor Ave
- 836 S Weyant Ave
- 842 S Hampton Rd
- 1271 S Weyant Ave
- 1048 S James Rd
- 733 S Napoleon Ave
- 804 S Ashburton Rd
- 711 S Waverly St
- 708 S Waverly St
- 1077-1079 S James Rd
- 3566 Seabrook Ave
- 3012 Hampshire Rd
- 931 E Fulton St
- 3345 Towers Ct S
- 3359 Towers Ct S
- 3337 Towers Ct S
- 3359 Towers Ct
- 1093 Barnett Rd
- 1093 Barnett Rd Unit 95
- 3371 Towers Ct
- 3331 Towers Ct S
- 3377 Towers Ct
- 3346 Towers Ct S
- 3336 Towers Ct S
- 3366 Towers Ct S
- 3385 Towers Ct
- 3347 Towers Ct S
- 3347 Towers Ct N
- 3328 Towers Ct S
- 1101 Barnett Rd
- 1109 Barnett Rd
- 3391 Towers Ct
- 3317 Towers Ct S