Estimated Value: $421,000 - $433,491
4
Beds
2
Baths
1,900
Sq Ft
$224/Sq Ft
Est. Value
About This Home
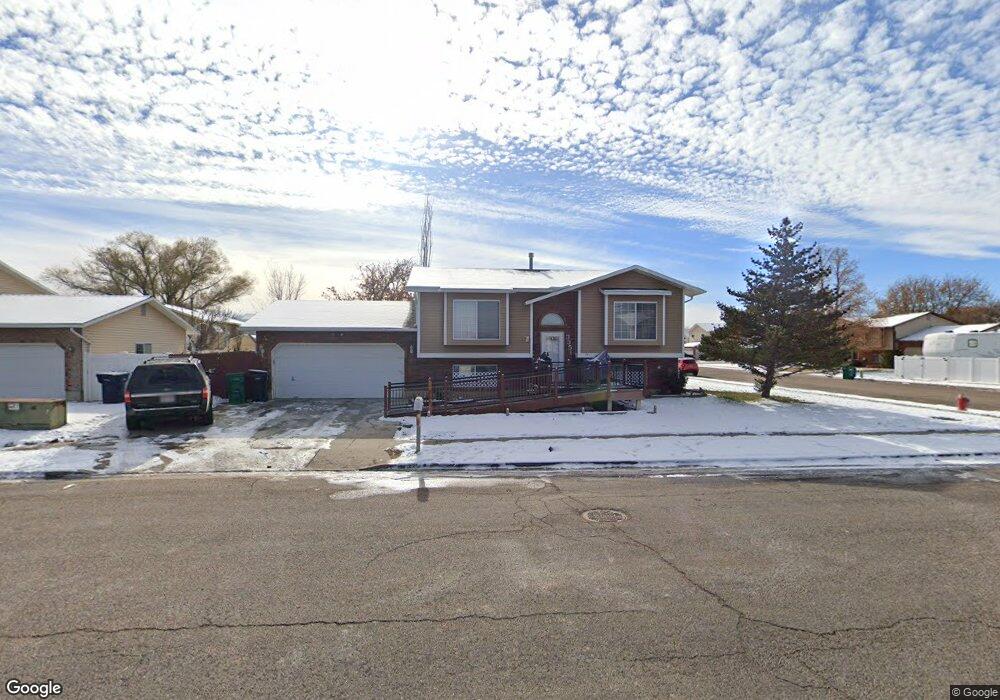
This home is located at 3351 W 4825 S, Roy, UT 84067 and is currently estimated at $426,123, approximately $224 per square foot. 3351 W 4825 S is a home located in Weber County with nearby schools including Midland School, Sand Ridge Junior High School, and Roy High School.
Ownership History
Date
Name
Owned For
Owner Type
Purchase Details
Closed on
Dec 23, 2025
Sold by
Desalazar Julia B
Bought by
Desalazar Julia B and Salazar Kim
Current Estimated Value
Purchase Details
Closed on
Feb 7, 2020
Sold by
Salazar Bruno A and Salazar Julia B
Bought by
Rodas Bruno Antonio Salazar and Salazar Julia B
Home Financials for this Owner
Home Financials are based on the most recent Mortgage that was taken out on this home.
Original Mortgage
$200,000
Interest Rate
3.72%
Mortgage Type
New Conventional
Purchase Details
Closed on
Aug 6, 2008
Sold by
Douglas Dennis E
Bought by
Salazar Bruno A and Salazar Julia B
Home Financials for this Owner
Home Financials are based on the most recent Mortgage that was taken out on this home.
Original Mortgage
$173,773
Interest Rate
6.42%
Mortgage Type
FHA
Purchase Details
Closed on
Apr 17, 2006
Sold by
Douglas Dennis E and Douglas Dorothy M
Bought by
Douglas Dennis E
Create a Home Valuation Report for This Property
The Home Valuation Report is an in-depth analysis detailing your home's value as well as a comparison with similar homes in the area
Home Values in the Area
Average Home Value in this Area
Purchase History
| Date | Buyer | Sale Price | Title Company |
|---|---|---|---|
| Desalazar Julia B | -- | None Listed On Document | |
| Rodas Bruno Antonio Salazar | -- | Frontier Title Ins Agency | |
| Salazar Bruno A | -- | First American Legend Hills | |
| Douglas Dennis E | -- | None Available |
Source: Public Records
Mortgage History
| Date | Status | Borrower | Loan Amount |
|---|---|---|---|
| Previous Owner | Rodas Bruno Antonio Salazar | $200,000 | |
| Previous Owner | Salazar Bruno A | $173,773 |
Source: Public Records
Tax History
| Year | Tax Paid | Tax Assessment Tax Assessment Total Assessment is a certain percentage of the fair market value that is determined by local assessors to be the total taxable value of land and additions on the property. | Land | Improvement |
|---|---|---|---|---|
| 2025 | $2,584 | $408,992 | $135,000 | $273,992 |
| 2024 | $2,527 | $221,649 | $74,630 | $147,019 |
| 2023 | $2,335 | $204,050 | $66,031 | $138,019 |
| 2022 | $2,550 | $231,550 | $60,664 | $170,886 |
| 2021 | $2,010 | $298,000 | $80,266 | $217,734 |
| 2020 | $1,934 | $264,000 | $80,266 | $183,734 |
| 2019 | $1,883 | $242,000 | $45,216 | $196,784 |
| 2018 | $1,788 | $216,000 | $40,236 | $175,764 |
| 2017 | $1,580 | $177,000 | $40,236 | $136,764 |
| 2016 | $1,543 | $93,039 | $22,036 | $71,003 |
| 2015 | $1,398 | $85,787 | $22,036 | $63,751 |
| 2014 | $1,391 | $84,503 | $21,415 | $63,088 |
Source: Public Records
Map
Nearby Homes
- 3509 W 4835 S Unit 26
- 3517 W 4835 S Unit 27
- 3618 W 4835 S Unit 6
- 5155 S 3200 W
- 3443 W 5200 S Unit 2&3
- 3405 W 4525 S
- 4793 S 3025 W
- 4491 Haven Creek Rd Unit A
- 3588 W 5225 S
- 4489 S 3375 W
- 3766 W 4750 S
- 4435 Cross Creek Rd Unit 29C
- 5141 S 2975 W
- 4891 S 2875 W
- 3610 W 4475 S
- 4813 S 3850 W
- 2953 W 4650 S
- 2872 W 5000 S
- 5248 S 3750 W
- 3878 W 4700 S
Your Personal Tour Guide
Ask me questions while you tour the home.