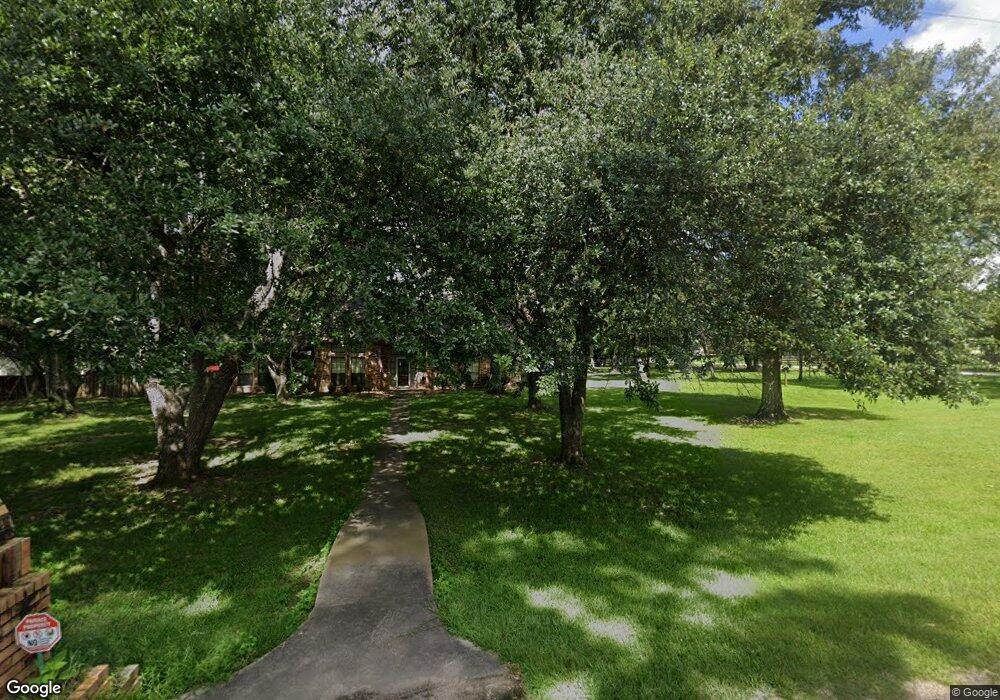
33511 Deer Run St Magnolia, TX 77355
Estimated Value: $591,000 - $686,239
4
Beds
3
Baths
2,925
Sq Ft
$215/Sq Ft
Est. Value
About This Home
This home is located at 33511 Deer Run St, Magnolia, TX 77355 and is currently estimated at $629,310, approximately $215 per square foot. 33511 Deer Run St is a home located in Montgomery County with nearby schools including Decker Prairie Elementary School, Tomball Intermediate School, and Tomball Junior High School.
Ownership History
Date
Name
Owned For
Owner Type
Purchase Details
Closed on
Jul 24, 2013
Sold by
Kellow Raymond T and Kellow Donna W
Bought by
Wilson Michael and Wilson Jeanne
Current Estimated Value
Home Financials for this Owner
Home Financials are based on the most recent Mortgage that was taken out on this home.
Original Mortgage
$254,000
Outstanding Balance
$185,241
Interest Rate
3.99%
Mortgage Type
New Conventional
Estimated Equity
$444,069
Purchase Details
Closed on
Jul 9, 2003
Sold by
Crowe James Byron and Crowe Judy A
Bought by
Vadell Jon and Vadell Loretta
Purchase Details
Closed on
Mar 29, 1999
Sold by
Liffick William C and Liffick Faye
Bought by
Kellow Raymond T and Kellow Donna W
Purchase Details
Closed on
Dec 1, 1988
Bought by
Wilson Michael and Wilson Jeanne
Create a Home Valuation Report for This Property
The Home Valuation Report is an in-depth analysis detailing your home's value as well as a comparison with similar homes in the area
Home Values in the Area
Average Home Value in this Area
Purchase History
| Date | Buyer | Sale Price | Title Company |
|---|---|---|---|
| Wilson Michael | -- | Stewart Title | |
| Vadell Jon | -- | Texas American Title | |
| Kellow Raymond T | -- | Chicago Title | |
| Wilson Michael | -- | -- |
Source: Public Records
Mortgage History
| Date | Status | Borrower | Loan Amount |
|---|---|---|---|
| Open | Wilson Michael | $254,000 |
Source: Public Records
Tax History Compared to Growth
Tax History
| Year | Tax Paid | Tax Assessment Tax Assessment Total Assessment is a certain percentage of the fair market value that is determined by local assessors to be the total taxable value of land and additions on the property. | Land | Improvement |
|---|---|---|---|---|
| 2025 | $7,207 | $450,000 | $48,700 | $401,300 |
| 2024 | $6,431 | $519,398 | -- | -- |
| 2023 | $6,431 | $472,180 | $48,700 | $501,400 |
| 2022 | $7,930 | $429,250 | $48,700 | $0 |
| 2021 | $7,498 | $390,230 | $48,700 | $341,530 |
| 2020 | $7,776 | $387,990 | $48,700 | $339,290 |
| 2019 | $7,574 | $383,600 | $48,700 | $334,900 |
| 2018 | $7,142 | $380,000 | $48,700 | $331,300 |
| 2017 | $7,388 | $355,000 | $16,290 | $338,710 |
| 2016 | $7,388 | $355,000 | $16,290 | $338,710 |
| 2015 | $6,771 | $363,000 | $16,290 | $462,060 |
| 2014 | $6,771 | $330,000 | $16,290 | $313,710 |
Source: Public Records
Map
Nearby Homes
- 33819 Ansley Rd
- 13506 Stagecoach Rd
- 2103 Diane St
- TBD Stagecoach Rd
- 2007 Diane St
- 33401 Doe Dr
- 14810 Timberleaf Dr
- Lot 34 Walnut Crossing
- 2102 Candy St
- 1801 Coe Rd
- 1439 Northwood Bluff Ln
- 35425 Woodtrace Cir
- 1426 Northwood Bluff Ln
- Lot 11 Walnut Grove Ln
- Lot 9 Walnut Grove Ln
- Lot 10 Walnut Grove Ln
- 33710 Walnut Grove Dr
- 1004 Ivy Meadow Ln
- 1005 Ivy Meadow Ln
- 1219 Coe Rd
- 14102 Deer Run St
- 14107 Decker Dr
- 14102 Decker Dr
- 33510 Deer Run St
- 14006 Deer Run St
- 14006 Decker Dr
- 14106 Deer Run St
- 14106 Decker Dr
- 14002 Decker Dr
- 14110 Deer Run St
- 14103 Deer Run St
- 14110 Decker Dr
- 14107 Deer Run St
- 14002 Deer Run St
- 14007 Deer Run St
- 14111 Deer Run St
- 14203 Decker Dr
- 14202 Decker Dr
- 14202 Decker Dr
- 14135 Stagecoach Rd