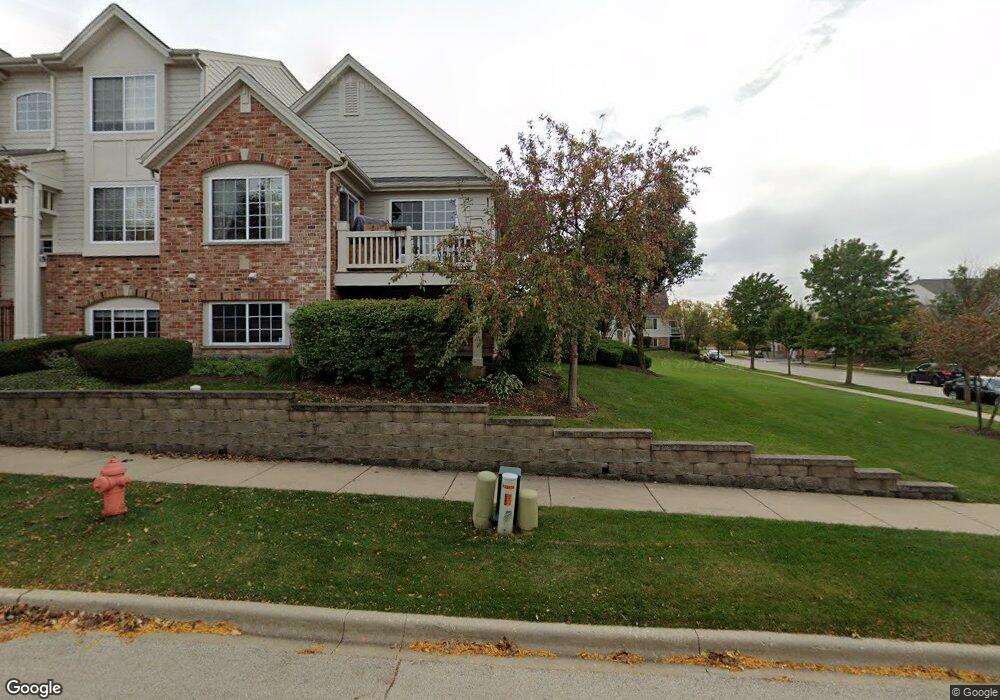
3353 Cameron Dr Unit 115 Elgin, IL 60124
Far West Elgin NeighborhoodEstimated Value: $278,000 - $296,182
2
Beds
3
Baths
1,700
Sq Ft
$170/Sq Ft
Est. Value
About This Home
This home is located at 3353 Cameron Dr Unit 115, Elgin, IL 60124 and is currently estimated at $288,546, approximately $169 per square foot. 3353 Cameron Dr Unit 115 is a home located in Kane County with nearby schools including Country Trails Elementary School, Prairie Knolls Middle School, and Central Middle School.
Ownership History
Date
Name
Owned For
Owner Type
Purchase Details
Closed on
Apr 1, 2016
Sold by
Secretary Of Housing & Urban Development
Bought by
Mcgrath Mollie M
Current Estimated Value
Home Financials for this Owner
Home Financials are based on the most recent Mortgage that was taken out on this home.
Original Mortgage
$130,952
Outstanding Balance
$102,997
Interest Rate
3.87%
Mortgage Type
FHA
Estimated Equity
$185,549
Purchase Details
Closed on
Oct 15, 2015
Sold by
Flagstar Bank Fsb
Bought by
Secretary Of Housing & Urban Development
Purchase Details
Closed on
Oct 30, 2013
Sold by
Burrill Jeffrey L and Burrill Jeffrey
Bought by
Flagstar Bank
Purchase Details
Closed on
Oct 11, 2011
Sold by
Burrill Jeffrey L and Jimenez Adriana I
Bought by
Burrill Jeffrey L and Jimenea Adriana I
Purchase Details
Closed on
Sep 28, 2007
Sold by
Lennar Communities Of Chicago Llc
Bought by
Burrill Jeffrey L and Jimenez Gomez Adriana I
Home Financials for this Owner
Home Financials are based on the most recent Mortgage that was taken out on this home.
Original Mortgage
$228,375
Interest Rate
6.55%
Mortgage Type
FHA
Create a Home Valuation Report for This Property
The Home Valuation Report is an in-depth analysis detailing your home's value as well as a comparison with similar homes in the area
Home Values in the Area
Average Home Value in this Area
Purchase History
| Date | Buyer | Sale Price | Title Company |
|---|---|---|---|
| Mcgrath Mollie M | $128,000 | Prairie Title | |
| Secretary Of Housing & Urban Development | -- | Attorney | |
| Flagstar Bank | -- | None Available | |
| Burrill Jeffrey L | -- | None Available | |
| Burrill Jeffrey L | $232,000 | North American Title Co |
Source: Public Records
Mortgage History
| Date | Status | Borrower | Loan Amount |
|---|---|---|---|
| Open | Mcgrath Mollie M | $130,952 | |
| Previous Owner | Burrill Jeffrey L | $228,375 |
Source: Public Records
Tax History
| Year | Tax Paid | Tax Assessment Tax Assessment Total Assessment is a certain percentage of the fair market value that is determined by local assessors to be the total taxable value of land and additions on the property. | Land | Improvement |
|---|---|---|---|---|
| 2024 | $6,785 | $85,262 | $19,760 | $65,502 |
| 2023 | $6,475 | $77,028 | $17,852 | $59,176 |
| 2022 | $6,154 | $70,236 | $16,278 | $53,958 |
| 2021 | $5,935 | $65,666 | $15,219 | $50,447 |
| 2020 | $5,751 | $62,688 | $14,529 | $48,159 |
| 2019 | $5,565 | $59,714 | $13,840 | $45,874 |
| 2018 | $5,264 | $56,254 | $13,038 | $43,216 |
| 2017 | $5,051 | $53,181 | $12,326 | $40,855 |
| 2016 | $5,704 | $49,337 | $11,435 | $37,902 |
| 2015 | -- | $45,222 | $10,481 | $34,741 |
| 2014 | -- | $44,664 | $10,352 | $34,312 |
| 2013 | -- | $45,842 | $10,625 | $35,217 |
Source: Public Records
Map
Nearby Homes
- 3340 Cameron Dr Unit 176
- 3374 Cameron Dr Unit 144
- 436 W Amberside Dr
- 2936 Avalon Dr
- 218 Middleton Ct
- 2843 Winchester Dr
- 250 Water Lily Ln
- 3803 Ivy Ln
- 2830 Colonial Dr
- 3825 Honeysuckle Ln
- 2829 Randall Ridge Dr
- 3770 Westbury Ct
- 3828 Gansett Pkwy
- 3032 Long Common Pkwy
- 3056 Mosedale St
- 315 Snowdrop Ln
- 264 Snowdrop Ln
- 313 Snowdrop Ln
- 268 Snowdrop Ln
- 282 Snowdrop Ln
- 3347 Cameron Dr Unit 103
- 3351 Cameron Dr Unit 101
- 3345 Cameron Dr Unit 104
- 3353 Cameron Dr Unit 3353
- 3357 Cameron Dr Unit 113
- 3361 Cameron Dr Unit 111
- 3355 Cameron Dr Unit 114
- 3359 Cameron Dr Unit 112
- 3349 Cameron Dr Unit 102
- 3343 Cameron Dr Unit 105
- 3337 Cameron Dr Unit 1203
- 3331 Cameron Dr Unit 1206
- 3333 Cameron Dr Unit 1205
- 3335 Cameron Dr Unit 1204
- 3339 Cameron Dr Unit 1202
- 3341 Cameron Dr Unit 1201
- 3344 Cameron Dr Unit 165
- 3346 Cameron Dr Unit 164
- 3348 Cameron Dr Unit 163
- 3352 Cameron Dr Unit 161
Your Personal Tour Guide
Ask me questions while you tour the home.