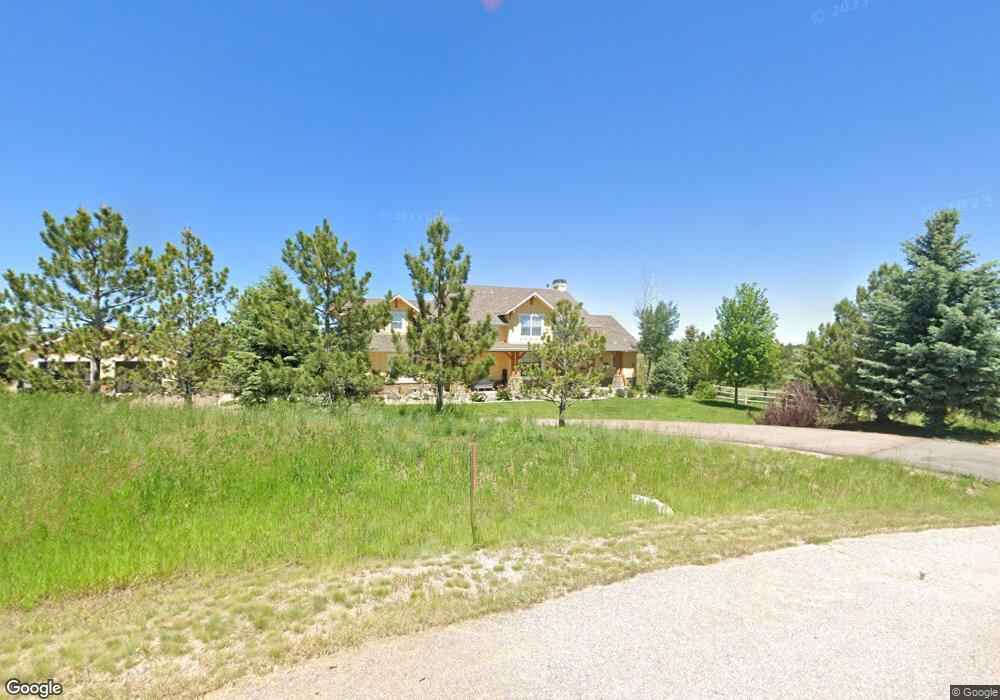
33535 Greystone Cir Elizabeth, CO 80107
Estimated Value: $1,243,569 - $1,286,000
5
Beds
4
Baths
4,933
Sq Ft
$257/Sq Ft
Est. Value
About This Home
This home is located at 33535 Greystone Cir, Elizabeth, CO 80107 and is currently estimated at $1,267,642, approximately $256 per square foot. 33535 Greystone Cir is a home located in Elbert County with nearby schools including Elizabeth High School and Legacy Academy.
Ownership History
Date
Name
Owned For
Owner Type
Purchase Details
Closed on
Apr 25, 2019
Sold by
Salansky Mark and Salansky Sara
Bought by
Fultz Michael and Garner Connie
Current Estimated Value
Home Financials for this Owner
Home Financials are based on the most recent Mortgage that was taken out on this home.
Original Mortgage
$466,000
Outstanding Balance
$408,863
Interest Rate
4.2%
Mortgage Type
New Conventional
Estimated Equity
$858,779
Purchase Details
Closed on
Jan 25, 2013
Sold by
Hooper Robert G and Hooper Jeannette N
Bought by
Salansky Mark and Salansky Sara
Purchase Details
Closed on
Jan 9, 2006
Sold by
Wild Pointe Partners Inc
Bought by
Hooper Ii Robert G and Hooper Jeannette N
Home Financials for this Owner
Home Financials are based on the most recent Mortgage that was taken out on this home.
Original Mortgage
$475,000
Interest Rate
6.2%
Mortgage Type
Fannie Mae Freddie Mac
Create a Home Valuation Report for This Property
The Home Valuation Report is an in-depth analysis detailing your home's value as well as a comparison with similar homes in the area
Home Values in the Area
Average Home Value in this Area
Purchase History
| Date | Buyer | Sale Price | Title Company |
|---|---|---|---|
| Fultz Michael | $760,000 | First American Title | |
| Salansky Mark | $530,000 | None Available | |
| Hooper Ii Robert G | $617,148 | Security Title |
Source: Public Records
Mortgage History
| Date | Status | Borrower | Loan Amount |
|---|---|---|---|
| Open | Fultz Michael | $466,000 | |
| Previous Owner | Hooper Ii Robert G | $475,000 |
Source: Public Records
Tax History Compared to Growth
Tax History
| Year | Tax Paid | Tax Assessment Tax Assessment Total Assessment is a certain percentage of the fair market value that is determined by local assessors to be the total taxable value of land and additions on the property. | Land | Improvement |
|---|---|---|---|---|
| 2024 | $8,318 | $70,070 | $19,100 | $50,970 |
| 2023 | $8,318 | $70,070 | $19,100 | $50,970 |
| 2022 | $7,439 | $55,970 | $15,990 | $39,980 |
| 2021 | $7,635 | $57,580 | $16,450 | $41,130 |
| 2020 | $8,160 | $59,100 | $8,580 | $50,520 |
| 2019 | $8,163 | $59,100 | $8,580 | $50,520 |
| 2018 | $6,887 | $49,550 | $8,640 | $40,910 |
| 2017 | $6,890 | $49,550 | $8,640 | $40,910 |
| 2016 | $6,852 | $48,910 | $5,890 | $43,020 |
| 2015 | $5,716 | $48,910 | $5,890 | $43,020 |
| 2014 | $5,716 | $39,990 | $5,570 | $34,420 |
Source: Public Records
Map
Nearby Homes
- 1535 Legacy Trail
- 33320 Ridgeview Loop
- 1307 Black Haw St
- 39817 Bradley St
- 39827 Bradley St
- 39818 Bradley St
- 39868 Bradley St
- 39838 Bradley St
- 39837 Bradley St
- 39846 Gibson St
- 39856 Gibson St
- 1020 Black Saddle St
- 1246 Black Haw St
- 1122 High Point Trail
- 907 W Beverly St
- 2550 Gold Creek Dr
- 970 Horsetail Loop
- 34856 Mustang Trail
- 32660 Legacy Ridge St
- 1991 County Road 132
- 33515 Greystone Cir
- 33540 Greystone Cir
- 33625 Tribute Cir
- 33495 Greystone Cir
- 33620 Tribute Cir
- 33290 Wyndham Cir
- 33615 Tribute Cir
- 33500 Greystone Cir
- 33610 Tribute Cir
- 33305 Viewpoint Cir
- 33325 Viewpoint Cir
- 33335 Greystone Cir
- 33725 Wildflower
- 33715 Wildflower
- 1548 Legacy Trail
- 33280 Wyndham Cir
- 1650 Legacy Trail
- 33335 Viewpoint Cir
- 1574 Highway 86
- 1528 Legacy Trail