33540 Riley Rd Walkerton, IN 46574
Estimated Value: $331,000 - $526,025
3
Beds
3
Baths
1,689
Sq Ft
$259/Sq Ft
Est. Value
About This Home
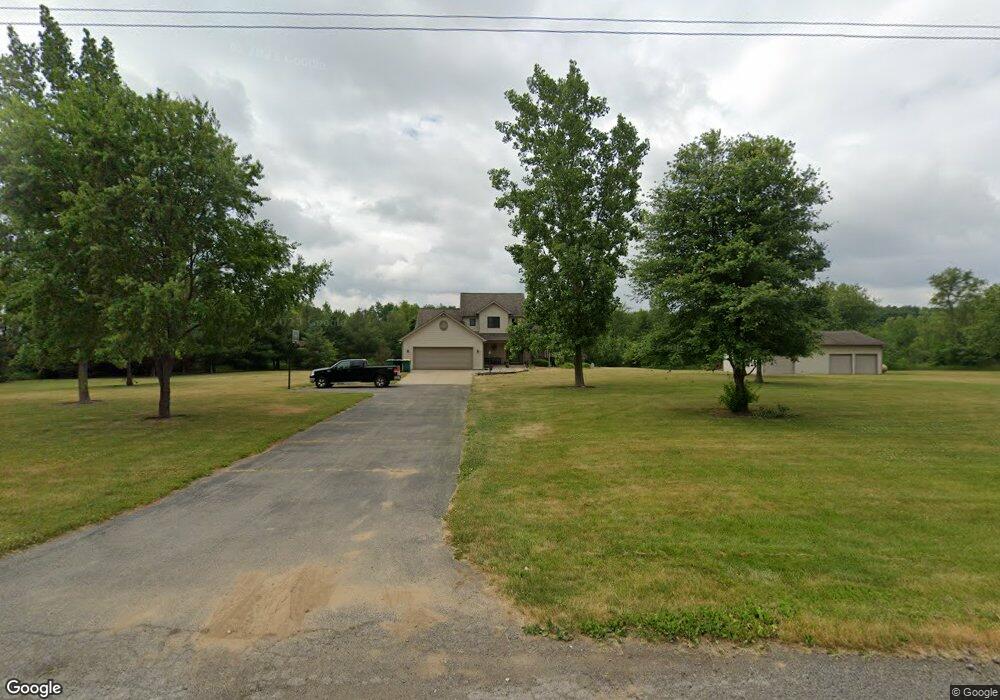
This home is located at 33540 Riley Rd, Walkerton, IN 46574 and is currently estimated at $436,756, approximately $258 per square foot. 33540 Riley Rd is a home located in St. Joseph County with nearby schools including John Glenn High School.
Ownership History
Date
Name
Owned For
Owner Type
Purchase Details
Closed on
Apr 3, 2020
Sold by
Brady Christopher P and Brady Emily J
Bought by
Brady Christopher P and Brady Emily J
Current Estimated Value
Home Financials for this Owner
Home Financials are based on the most recent Mortgage that was taken out on this home.
Original Mortgage
$258,000
Outstanding Balance
$229,412
Interest Rate
3.6%
Mortgage Type
New Conventional
Estimated Equity
$207,344
Purchase Details
Closed on
Jun 7, 2016
Sold by
Williams Wendy S
Bought by
Brady Christopher P and Bikowski Emily J
Home Financials for this Owner
Home Financials are based on the most recent Mortgage that was taken out on this home.
Original Mortgage
$273,916
Interest Rate
3.57%
Mortgage Type
New Conventional
Purchase Details
Closed on
Apr 22, 2010
Sold by
Bair Cori S and Bair Wendy S
Bought by
Bair Wendy S
Create a Home Valuation Report for This Property
The Home Valuation Report is an in-depth analysis detailing your home's value as well as a comparison with similar homes in the area
Home Values in the Area
Average Home Value in this Area
Purchase History
| Date | Buyer | Sale Price | Title Company |
|---|---|---|---|
| Brady Christopher P | -- | None Available | |
| Brady Christopher P | -- | -- | |
| Bair Wendy S | -- | -- |
Source: Public Records
Mortgage History
| Date | Status | Borrower | Loan Amount |
|---|---|---|---|
| Open | Brady Christopher P | $258,000 | |
| Closed | Brady Christopher P | $273,916 |
Source: Public Records
Tax History Compared to Growth
Tax History
| Year | Tax Paid | Tax Assessment Tax Assessment Total Assessment is a certain percentage of the fair market value that is determined by local assessors to be the total taxable value of land and additions on the property. | Land | Improvement |
|---|---|---|---|---|
| 2024 | $4,787 | $352,500 | $165,900 | $186,600 |
| 2023 | $4,902 | $354,500 | $165,900 | $188,600 |
| 2022 | $4,965 | $354,500 | $165,900 | $188,600 |
| 2021 | $3,984 | $290,100 | $119,100 | $171,000 |
| 2020 | $4,431 | $320,300 | $130,900 | $189,400 |
| 2019 | $4,473 | $327,400 | $132,000 | $195,400 |
| 2018 | $3,735 | $271,200 | $107,300 | $163,900 |
| 2017 | $3,801 | $280,400 | $107,300 | $173,100 |
| 2016 | $3,523 | $282,300 | $107,300 | $175,000 |
| 2014 | $3,719 | $288,800 | $107,300 | $181,500 |
Source: Public Records
Map
Nearby Homes
- Vacant Land E 525 S
- 31513 Shively Rd
- 314 Roosevelt Rd
- 603 Monroe St
- 802 Roosevelt Rd
- 804 Van Buren St
- TBD E U S 6
- 905 Van Buren St
- 103 Clark St
- 109 Red Tail Ct
- 107 Red Tail Ct
- 1070 Walkerton Trail
- 30430 Osborne Rd
- 7237 E 370 S
- 315 Holly Dr
- 0 Cherry Dr
- 605 S State St
- 613 W Pine St
- US 6 East Dr
- 212 S William St